Introduction
Different tissues can be used for the extraction of DNA in order to analyse the bird’s genetics. Blood and organs provide a rich source of DNA, requiring only a small sample for high-quality DNA. Depending on the species of the bird, some blood can be drawn from non-heparinised capillaries by piercing the leg vein (Norris-Caneda and Elliott 278). Feathers can also provide DNA, though the quality and quantity of DNA is much less than that found in the former. When using feathers, Polymerase Chain Reaction (PCR) enables the creation of many copies of a specific region of the genome, which makes it easier to visualize the difference between the samples through gel electrophoresis. In feathers, DNA can be obtained from the cells close to the body, calamus, or from the blood clot embedded in the shaft (Norris-Caneda and Elliott 278). To avert deterioration of the DNA, the samples obtained are kept under favourable conditions. To separate and purify DNA from the sample, the Qiagen DNeasy Blood & Tissue Kit is used (Norris-Caneda and Elliott 278).
The female bird is the heterogenic sex. As such, females have two bands (WZ) while males (homogametic) have one (ZZ). Females and males are easily identified in sexually dimorphic species; however, many species are sexually monomorphic (Ellegren 193). In order to identify the sex for monomorphic species, molecular markers are used. It is difficult to determine the sex for most bird species and chicks from their phenotype, since they are monomorphic. To overcome the challenge, there are universal markers that can be used to distinguish between male and female sexes reliably. Design of the markers was based on targeting highly conserved primer flanking regions within the chromo-helicase-DNA binding gene 1 (CHD1), carried on the sex chromosome of birds (Ellegren 193). The sex of an individual is determined by detecting a size difference between CHD1 on the W chromosome (CHD1W) (female) and the CHD1 variant the Z chromosome (CDH1Z) (male).
PCR is used on the genomic DNA extracted to amplify the CHD1 and visualize the product using gel electrophoresis. This process is necessary to identify the sex of a bird. Males have one band (zz), while females have two bands (WZ). Sex identification for birds and nestlings cannot be determined from evaluation of their external morphology. This process is, therefore essential for successful application of breeding programs (Bártová, Dubská and Literák).
Methods
DNA extraction and visualization
A Pipette was used to measure 20 μL of proteinase K, which was then transferred into a sterile1.5 mL micro centrifuge tube. 166 μL of PBS and 4 μL RNase A was then added to the tube. A sample of the preserved chicken blood card was cut into quarters, and the card transferred to the tube using sterile forceps. After incubation for 30 minutes at room temperature, 200 μL of Buffer AL. was added and mixed thoroughly by vortexing for 15 seconds. A lid was placed on the tube and incubated at 56°C for 30 minutes to lyse the cells. 200 μL of 95% ethanol was then added to the sample and carefully mixed for 15 seconds, to precipitate the DNA in preparation for bounding to the membrane.
The liquid was carefully transferred into the DNeasy Mini spin column, using a pipette, to avoid touching the white membrane at the base of the column. The spin column was spun in a centrifuge at 6000 x g (8000 rpm) for 1 minute to bind the DNA to the membrane, and the flow through liquid and collection tube were discarded. Centrifugation was used to clean the DNA in order to eliminate all traces of ethanol. The tube containing DNA was stored at -200c while preparing the gel. Once the gel was ready, it was placed on the transilluminator box of the Gel Doc apparatus, and the door was closed. The focus was adjusted using white light, so that the gel and the wells could be clearly seen. The UV light was then turned on, and the exposure adjusted to view the sample and the marker clearly. The images were then frozen and copied for analysis.
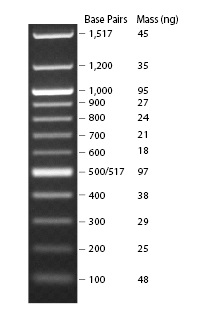
The brightness of the sample on the gel was compared to the various brands in the molecular weight marker to identify a band with similar brightness. The concentration of DNA of the sample was then determined by looking up the concentration in the reference band identified. Concentration of DNA in the sample was determined using the calculation below:
ng DNA in MWM reference band/ μL of sample DNA = ng/μL
PCR and visualization
In preparation for electrophoresis, 10 μL of PCR product was mixed with 2 μl of 6 x loading dye. The black casting plates and gel comb were removed before adding 1 X SB electrophoresis buffer until the buffer covered the whole gel by about 5 mm. 5 μL (0.5μg) of the 100 bp molecular weight marker were placed into the first well. The DNA sample was then placed into an empty well, and the well position of the sample was recorded on the gel loading guide. The cover was then applied to the electrophoresis unit and power was connected for 20 minutes at 300 V. during this process, DNA ran from the negative cathode (black cable) to the positive anode (red cable). After 20 minutes of running the gel, the power was switched off, and the leads disengaged. The gel tray was then carefully removed from the tank and transferred to a plastic container for visualization using the Gel Doc system.
To determine the size of the PCR product, the position of the PCR bands was compared to the size standard bands in the marker. The size of similar sized DNA bands was identified in the molecular weight marker, and the size of the PCR products determined. The results were recorded in a table.
Results section (30%) 2-3 pages
Section 1
The results from DNA extracted are shown below.
Sample 11 – 20
DNA was extracted from different tissue types, and the mean DNA concentration for each tissue type determined. The equation below was used to determine the average concentration of DNA.
ng DNA in MWM reference band/ μL of sample DNA = ng/μL
blood sample
Average concentration for the blood sample was found to be 7.6 ng / μL
Muscle
Average concentration for the muscle was found to be 9.4 ng / μL
Feather
Average concentration for the blood sample was found to be 6 ng / μL.
Reproducible DNA sexing results were obtained from the sample types. The highest mean DNA concentration was observed in the muscle, with the least concentration being observed in the feather as observed in the tables above.
Section 2
The results for the PCR product are indicated below, showing the positive and negative controls, and the size marker.
From sample 11 – 20

The samples representing the females with both W and Z chromosomes were identified from two strands. These samples were numbers 1, 3, 7, 14 and 19, while the male samples were numbers 2, 5, 6, 15 and 19. The positive control was relevant since it has low intensity on the gel than a W-linked fragment. This was necessary to reduce the possibility of wrong sexing.
Discussion section
Based on the experiments, it was determined that the tissue with the highest DNA concentration was the muscle with a concentration of 9.4 ng / μL. The blood tissues also had a high concentration at 7.6 ng / μL. The concentration of DNA in the feathers was found to be least at 6 ng / μL. This implies that the best factor to use in determining the sex of birds is blood tissue DNA.
Genes are a reliable marker for the identification of sex since they comprise functional DNA. This attribute makes them evolve slowly. The W chromosome contains few genes including the CHD gene. “The three CHD-related primer pairs used in sex identification were designed to flank the fragment of the gene with the intron” (Nesje and Roed 263). This property makes it possible to distinguish between the two chromosomes (W and Z), whereby females are known from two bands, and males from a single band (Nesje and Roed 263).
According to the results obtained, the primer produced a single fragment in both sexes. This can be attributed to the fact that there was more amplification of the shorter Z chromosome, compared to the W chromosome. The variation in magnitude, between Z- and W-specific fragments that are augmented with P2/P8 primers, lies between 10 and 80 bp. According to Cerit and Avanus (9), it is preferable to use polyacrylamide instead of agarose gels for the species with P2 primer, in the separation of the Z- and W-bands (Cerit and Avanus 371). The preference for polyacrylamide over agarose gels is in the ability of the former to provide better resolution (Cerit and Avanus 371).
The best option for determining the molecular sex of birds that have not been sexed is a CHD based technique. This is because the method is rather fast and accurate, after the selection of a suitable primer. Inconsistencies in the experiment can be attributed to the primer used, since different primers produce different results based on the bird species. More accurate results could have been produced with the inclusion of both P2/P8 and 2550F/2718R primers in the study. Accuracy of this method is in the fact that markers for specific species have a narrow application that is limited to few species. The process of sex identification may, therefore, take longer if existing markers are found to be irrelevant and the procedure requires screening of genomic DNA in order to find the W-linked sequences (Dubiec and Zagalska-Neubauer 4).
References
Bártová, Eva, Lenka Dubská and Ivan Literák. Practical lessons in molecular biology: sex determnation in birds. Palackého: University of Veterinary and Pharmaceutical Sciences, 2010.
Cerit, Harun and Kozet Avanus. “Sex Determination by CHDW and CHDZ Genes of Avian Sex Chromosomes in Nymphicus hollandicus.” Turk. J. Vet. Anim. Sci. 31.6 (2007): 371-374. Print.
Dubiec, Anna and Magdalena Zagalska-Neubauer. “Molecular techniques for sex identification in birds.” Biological Lett. 43.1 (2006): 3 – 12. Print.
Ellegren, Hans. “Hens, cocks and avian sex identification. Aquest for genes on Z or W?” EMBO Reports 2 (2001): 192 -196. Print.
Nesje, Maja and Knut Roed. “Sex identification in falcons using microsatellite DNA markers.” Hereditas 132 (2000): 261-263. Print.
Norris-Caneda, Kim and James Elliott. “Sex identification in Raptors using PCR.” j. Raptor Res. 32.4 (1998)::278-280.
Ohno, Susumu. Sex chromosomes and sex-linked genes. Springer Verlag, Berlin, 1967.
