American Trade Balances with Partner Countries

Trade balances with partner countries.

First, it is necessary to give the general numbers of the foreign trade of the USA.

  • The Year 2008 trade industry and the allover trade produced an $821 billion merchandise trade deficit, the 2nd largest negative trade balance in the history of the US economy.
  • Cumulative trade deficits have been observed since 1985, total $8.2 Trillion – creating a negative international net worth of $5 Trillion.
  • American annual international trade deficit is 35%, which is larger than Social Security spending, 50% larger than all defense spending, and 2.5 times larger than Medicare.

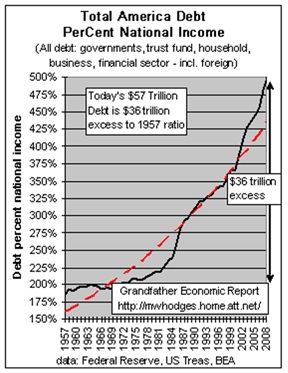
The allover situation is represented on the following chart. (chart below) Originally, this is the chart of the total external debt of the USA. As McConnell and Brue state: “If the debt dependence of the USA were not growing faster than the economy during the period 1975-2008, the GDP growth could be more extensive, and the overall trade balance would have quite the opposite image. Originally, much of that debt was promoted by Federal Reserve interest rate and government tax policies including more rapid debt growth lately fueled by record-low interest rates.”

total american debt percent national income graph

As for the comparison of the US trade with the trade of its trade partners, the following data is represented:

RankCountryExports (Year-to-Date)Imports (Year-to-Date)Total Trade (Year-to-Date)Percent of Total Trade
Total, All Countries246.6352.5599.1100.0%
Total, Top 15 Countries169.5260.6430.271.8%
1Canada47.052.399.416.6%
2China14.464.879.213.2%
3Mexico29.138.867.911.3%
4Japan12.721.834.45.7%
5Federal Republic of Germany11.116.828.04.7%
6United Kingdom11.710.722.43.7%
7Korea, South5.79.715.32.6%
8France7.08.415.32.6%
9Netherlands7.93.811.72.0%
10Brazil5.94.710.71.8%
Top trade partners
RankCountryExports (Year-to-Date)Percent of Total Exports
Total, All Countries246.6100.0%
Total, Top 15 Countries177.071.8%
1Canada47.019.1%
2Mexico29.111.8%
3China14.45.9%
4Japan12.75.1%
5United Kingdom11.74.8%
6Federal Republic of Germany11.14.5%
7Netherlands7.93.2%
8France7.02.8%
9Brazil5.92.4%
10Korea, South5.72.3%
Top 10 exporters
RankCountryImports (Year-to-Date)Percent of Total Imports
Total, All Countries352.5100.0%
Total, Top 15 Countries264.375.0%
1China64.818.4%
2Canada52.314.8%
3Mexico38.811.0%
4Japan21.86.2%
5Federal Republic of Germany16.84.8%
6United Kingdom10.73.0%
7Korea, South9.72.7%
8France8.42.4%
9Ireland7.32.1%
10Taiwan6.71.9%
Top 10 importers

Taking into account the analysis of the data represented in the tables, it should be stated that deficit and surplus countries are equally represented in the top 10 trading partners list.

Removal Request
This essay on American Trade Balances with Partner Countries was written by a student just like you. You can use it for research or as a reference for your own work. Keep in mind, though, that a proper citation is necessary.
Request for Removal

You can submit a removal request if you own the copyright to this content and don't want it to be available on our website anymore.

Send a Removal Request