Introduction
The purpose of this report is to conduct ratio analysis to evaluate the performances of Abu Dhabi Commercial Bank (UAE), Commercial Bank of Dubai, Emirates NBD (UAE), First Gulf Bank (UAE), and Union National Bank over a period of eight years (from 2008 to 2015) with regard to the Darien Analytics Survey. Therefore, this report outlines brief backgrounds of the banks, utilizes the calculated ratios to review the strengths and weaknesses of the banks through comparison and quantitative analysis, and proposes some apposite recommendations.
Background of the Banks
Emirates NBD (UAE)
It was established in 2007 after the merger of banks named Emirates Bank International and National Bank of Dubai, and at present, it is one of the largest banks in the UAE because of its extensive service range, net income, and number of branches; moreover, corporate, retail, and Islamic banking are the popular services of this bank (Emirates NBD 1). It has about 9000 employees, 220 branches, and 940 ATMs and CDMs all over the country; in addition, fast-growing Islamic banking affiliated entities along with strong investment help this bank to expand its business operation rapidly, and at present, more than 69% of its operating income is generated from corporate and retail banking (Cunningham 4). The Darien analytics survey demonstrates that the net profit of this bank is increasing significantly; for example, net profit was AED 3,256 million, AED 5,139 million, and AED 7,124 million in 2013, 2014 and 2015 consecutively (Cunningham 4); however, the financial ratios of this bank has been analyzed later on this paper. Emirates NBD concentrates more on the corporate governance in order to develop long-term value for all the stakeholders and to minimize risks by ensuring transparency and accountability by disclosing accurate information; furthermore, it is committed to focus on social investment for the welfare of people.
Abu Dhabi Commercial Bank (UAE)
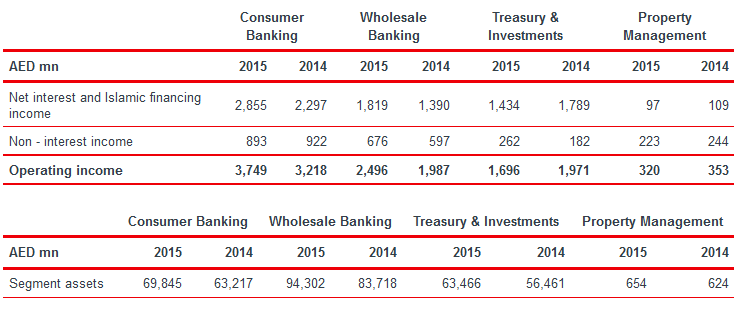
The UAE-based public joint stock company Abu Dhabi Commercial Bank is a full-service commercial bank and a major institute (from the perspective of shareholder funds and market capitalization) that was established in 1985 through the merger of Emirates Commercial Bank (ECB), Federal Commercial Bank (FCB), and KCB; however, the Government of Abu Dhabi holds more than 58% of its shares. This bank offers a variety of products and services, for instance, retail, private, corporate, commercial, and Islamic banking service, and has 690 thousand retail customers, about 52 thousand wholesale customers, 49 branches, 3 pay offices, and 304 ATMs all over the country; moreover, it has nearly 11% market share in loans and about 10% market share in deposits. According to the 2015 annual report of ADCB, it generated the highest profit from the consumer- banking sector; for example, its operating income from consumer- banking was AED 3218 million and 3749 million in 2014 and 2015 respectively, and the next figure provides more information about the segmental performance of ADCB:
It is important to argue that the strategic steps of this bank enhance its rapid growth and sustainable development (Abu Dhabi Commercial Bank 1); however, the following figure illustrates the strategies of ADCB:

Union National Bank
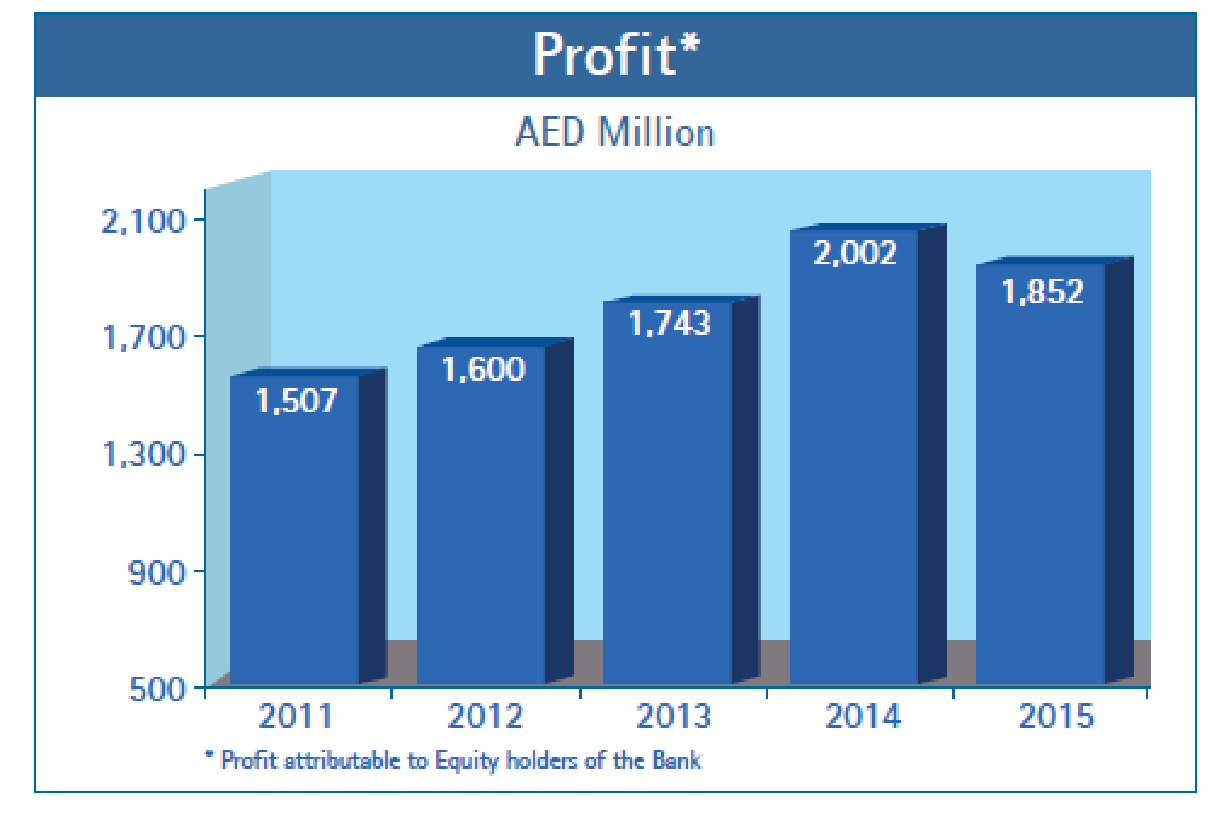
It is a public joint-stock company formed in 1982 under the laws of the UAE, where the Governments of Abu Dhabi and Dubai own 60% of the shares and the individuals hold 40% of the shares; in addition, it has an extensive network of banking centers all over the UAE. It has mainly focused on the fundamental requirements of the individuals along with complex requisites of the companies to become the first bank of choice for all stakeholders; as a result, it was able to complete the three-year mission (2012-2015) successfully and this has been reflected on its financial statement, where its operating income illustrated 7% increase from 2014 to 2015. On the other hand, according to the annual report of Union National Bank, corporate banking was the highest profit-generating segment in 2015, while Islamic banking dropped by 19%; therefore, net profit was reduced by AED 150 million in this period (Union National Bank 17), as shown in the figure below:
Commercial Bank of Dubai
It is essential to note at this stage that this banking and financial service corporation was founded in 1969 with a long-term goal of becoming a leading financial institution in UAE, and now, the citizens of the UAE and the Investment Corporation of Dubai jointly own 80% and 20% of its shares consecutively. It has already transformed its business in order to achieve its target; for example, it has diversified its income sources and penetrated into new sectors such as retail banking, SME finance, and Islamic banking segment, and despite the global financial crisis, it has maintained high levels of capital solvency (Commercial Bank of Dubai 12). According to the 2015 annual report of Commercial Bank of Dubai, it has maintained international standards to ensure transparency in preparing audit reports and disclosing financial statements to give fair treatment to all stakeholders; more precisely, it has concentrated on strategic priorities like client engagement, profitable growth, and employee engagement (Commercial Bank of Dubai 8).
First Gulf Bank (UAE)
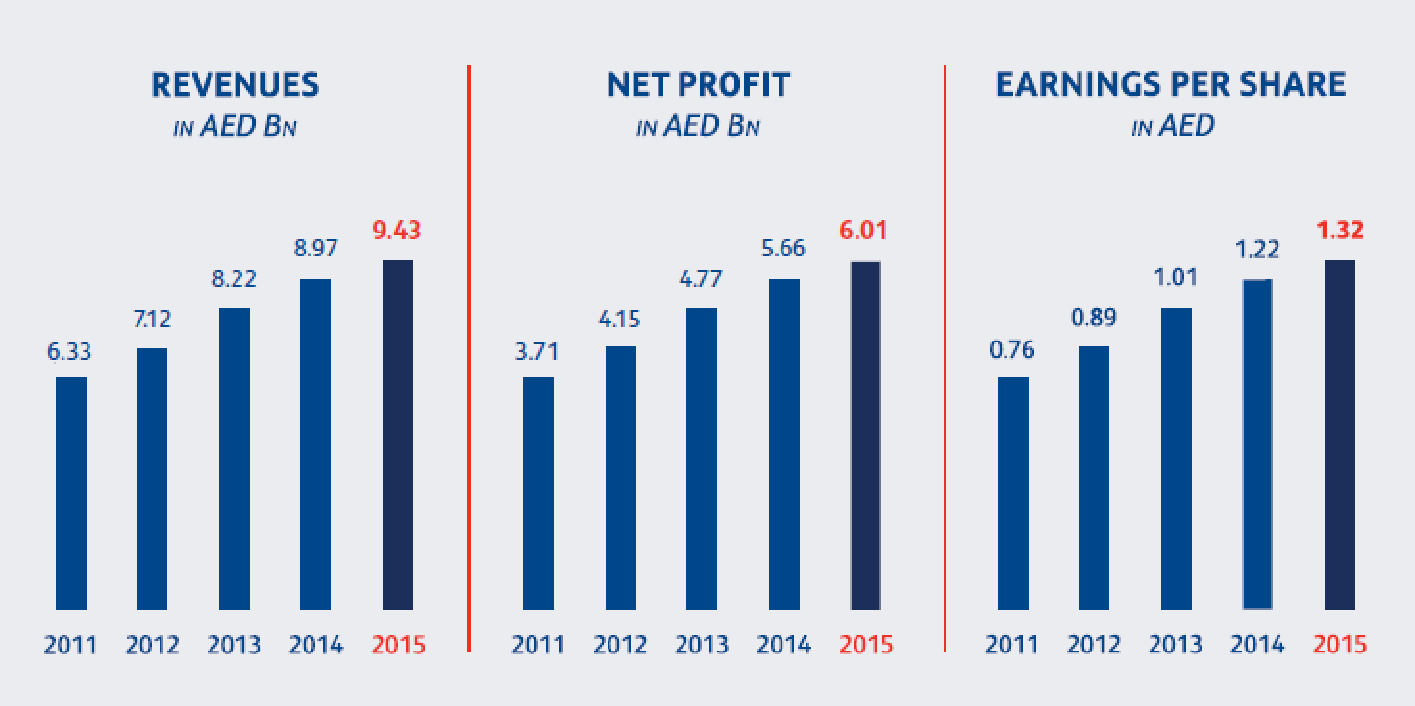
This bank started its business operation in 1979, and it provides financial services such as wholesale, consumer, treasury, and Islamic banking solutions to the individuals and companies in the UAE with the long-term objectives of expanding its operations all over the world and ensuring market-leading services for all its clients (First Gulf Bank 6). At present, it is the third-largest bank by assets, with more than 2000 employees; in fact, notwithstanding the volatile economic environment, it has experienced huge success in 2015 by maintaining stable financial ratios across all the business segments – the following figure shows the increasing net profit of the bank during last five years:
Analysis and Comparison of the Ratios of Five Banks for Eight Years
At this stage, it is essential to evaluate and compare all the ratios of the five banks (as provided in the Darien Analytics Survey) for a period of eight years in order to assess the strengths and weaknesses of the banks through a quantitative analysis. By means of this assessment, this paper also compares the ratios of the banks during the global financial crisis (2008 to 2011), and after the financial crisis (2012 to 2015).
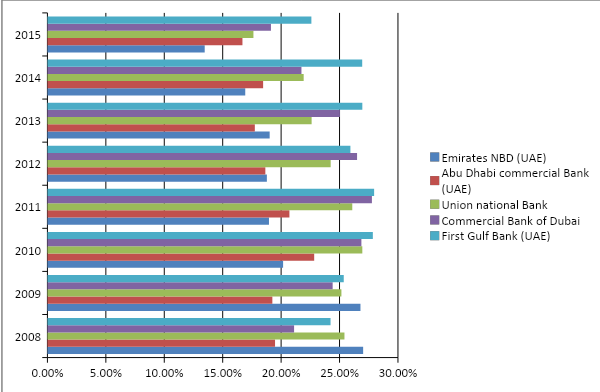
Equity to assets ratio
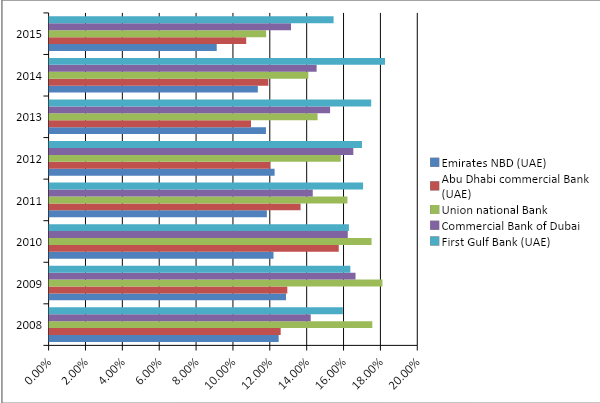
The following graph shows the equity to assets ratio of the five banks from 2008 to 2015, and it is notable that from 2008 to 2010, Union National Bank had the highest equity to assets ratio, whereas from 2010 onwards, this ratio gradually lowered for the bank. From 2011 to 2015, First Gulf Bank had the highest ratio amongst all the banks, which means that the institutional and private investors of this bank can request repayment from more assets in case of any corporate insolvency. As a result, it is safer for corporate investors to invest in such businesses where this particular ratio is relatively high, and it is apparent that from this perspective, at present First Gulf Bank is performing much better than the other banks. However, throughout the eight-year period, Emirates NBD has remained to be a poor performer consistently, while the position of Abu Dhabi Commercial Bank has remained quite unimpressive as well. As shown in the chart below, the Commercial Bank of Dubai, on the other hand, has performed quite well in 2015, 2014, 2013, 2012, and 2009. It is to be noted that in comparison to the 2008 to 2011 period, First Gulf Bank’s position developed significantly during the 2012 to 2015 period because as the impact of the global financial crisis is gradually diminishing, the positions of the businesses are developing as well:
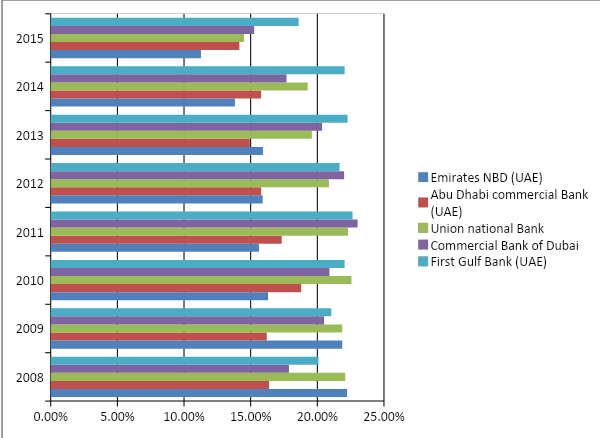
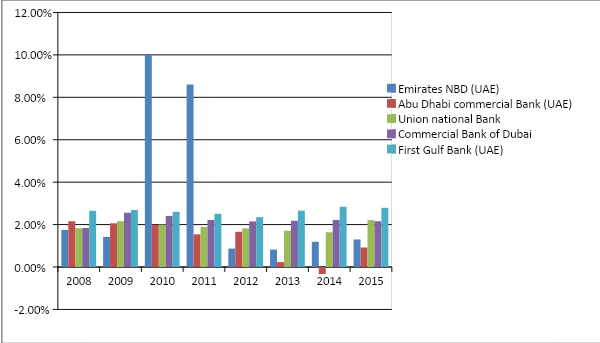
Equity to loans and investment ratio
The chart below shows that the equity to loans and investment ratio of the Emirates NBD was approximately 22% in 2008, 16% in 2010, 15% in 2012, 13% in 2014, and 11% in 2015. For Abu Dhabi Commercial Bank, the ratio was about 16% in 2008, 18% in 2010, 15% in 2012, 14% in 2013, and 14% in 2015, while in case of Union National Bank, the ratio was around 22% in 2008, 21% in 2009, 20% in 2012, 19% in 2013, and 14% in 2015. On the other hand, Commercial Bank of Dubai had equity to loans and investment ratio of approximately 20% in 2009, 17% in 2014, and 15% in 2015, whereas First Gulf Bank’s ratio was around 20% in 2008, 21% in 2009, 22% in 2013, and 18% in 2015. This trend indicates that to some extent, all the banks are facing falling equity to loans and investment ratio, and this could be the reason for volatile market conditions:
Operating profit to assets ratio
The following chart illustrates the ‘operating profit to assets ratio’ of the banks, which shows the revenue of the banks in comparison to their assets, providing good a perception to the investors about the competencies of the organizations in utilizing their assets to engender revenues. It is clearly visible that First Gulf Bank of the UAE is more efficient than the other banks in utilizing its assets to engender more revenues because from 2008 to 2014, this bank consistently performed better than that of its competitors in making use of its assets. In 2015, however, for some reason or the other, First Gulf Bank’s operating profit to assets ratio was slightly lower than the same ratio of the Commercial Bank of Dubai. Commercial Bank of Dubai remained to be the second-best performer amongst the five banks throughout this eight-year period when it comes to return on assets. The Union National Bank, on the other hand, was the third-best performer in 2015, 2012, 2011, and 2010, while Emirates NBD had successfully replaced it in 2008, 2009, 2013, and 2014. It is important to state that Abu Dhabi Commercial Bank had the lowest operating profit to assets ratio in 2008, 2009, 2012, and 2013:
Operating profit to loans and investments ratio
The following ratio calculates a business’s capability of confronting credit failures and alterations to security prices without announcing losses, and it is apparent from the collected data and the generated graph below that in this arena, from 2010 to 2015, First Gulf Bank had the highest capacity of facing credit failures. In 2008 and 2009, Emirates NBD of the UAE did better than First Gulf Bank, even though it was unable to maintain this good position in long run, and in 2015, 2011, and 2010, its performance in this particular ratio was the worst amongst the five banks. In 2014, 2013, 2010, 2011, and 2015, the Commercial Bank of Dubai demonstrated that it is the best bank in confronting credit failures after the First Gulf Bank, and in 2012, its performance was even better than the First Gulf Bank. It is important to argue that the Union National Bank was an average performer during these eight years, and Abu Dhabi Commercial Bank’s performance was unattractive for the investors as well during the same period. Nevertheless, it seems that the global financial crisis had no impact on the ‘operating profit to loans and investments ratio’ of the banks, as no clear differentiation is possible between the 2008–2011 periods and the 2012–2015 periods:
Equity and operating profit to average loss and investments ratio
First Gulf Bank was in a good position in terms of the equity and operating profit to average loss and investments ratio in 2015, 2014, 2013, 2011, and 2010, whereas in 2012, Commercial Bank of Dubai performed better than First Gulf Bank, and in 2008 and 2009, Emirates NBD performed better than the rest of the four banks. The Union National Bank remained in the third position from 2011 to 2015, but in 2010 and 2008, it was in the second position. On the other hand, as the chart below shows, Abu Dhabi Commercial Bank was not able to excel its potential in increasing this ratio fruitfully:
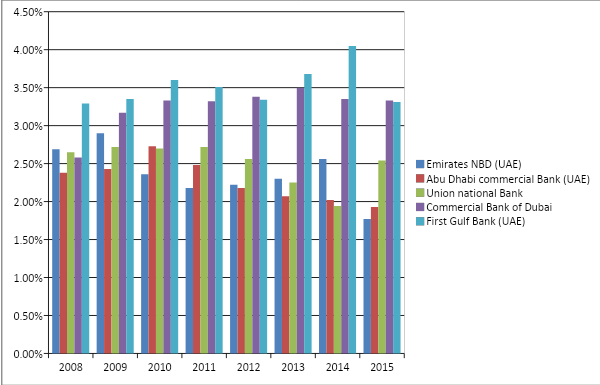
Net profit to average asset ratio
The net profit to average asset ratio calculates the turnover a business can bring about from its assets, and it is clear that numerous fluctuations have occurred in this ratio; for example, Emirates NBD performed extraordinarily in 2010 and 2011, but it failed to retain this position, and in the rest of the years, its performance was quite poor. Abu Dhabi Commercial Bank was the worst performer in 2010, 2011, 2013, and 2015, whereas in 2014, it incurred some losses against its assets. On the other hand, the First Gulf Bank was consistently in an excellent position throughout the eight years in comparison to the rest of the four banks, although in 2010 and 2011, it fell behind Emirates NBD. It is notable that Commercial Bank of Dubai was able to maintain mediocre returns from its assets, while the Union National Bank also remained as an underdog:
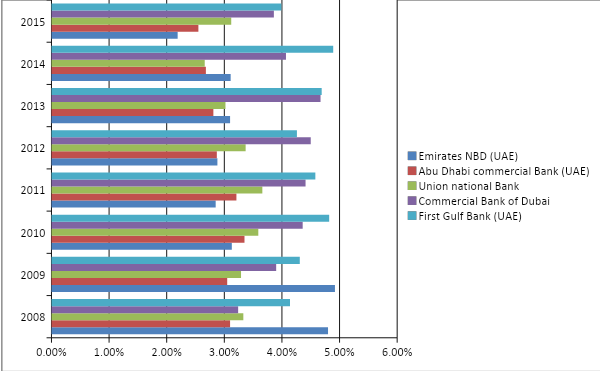
Net profit to average equity ratio
Net profit to average equity ratio determines the skill of businesses to engender resources internally, and it is essential to state that First Gulf Bank was the best performer in this ratio from 2009 to 2014, although in 2008 and 2015, Abu Dhabi Commercial Bank and Union National Bank occupied the best position respectively. As the graph below shows, Commercial Bank of Dubai, on the other hand, was also a consistent performer and it was the second-best bank in terms of the net profit to average equity ratio in 2010, 2011, 2013, and 2014. Abu Dhabi Commercial Bank did a fantastic job in 2008 and 2012, and in 2009, it was the second-best performer, but in 2013, its net profit to average equity ratio fell rapidly, while in 2014, it fell below zero. Emirates NBD performed poorly throughout the eight years, even though Union National Bank was able to develop its position greatly in 2015. It is vital to state that a business that achieves elevated quotient in both equity to assets ratio and net profit to average equity ratio, uses the equity with an incredible level of competence, and it has been noted that the First Gulf Bank has done well consistently in both these ratios, indicating its skills to handle equity.
Operating expenses to operating income ratio
The lesser the operating expenses to operating income ratio, the more profitable it is for the financial institutions; therefore, the banks that are low lying in the chart below are the best performers here. As a result, it can be argued that First Gulf Bank has the best ratio in this arena as well, since it has more operating income than the operating expenses in comparison with the rest of the four banks. Commercial Bank of Dubai performed well in 2014, whereas Union National Bank performed well in 2015, 2013, 2012, 2010, 2009, 2011, and 2008. Conversely, Emirates NBD and Abu Dhabi Commercial Bank had huge operating expenses than operating income throughout the whole period:
Customer deposits to assets ratio
It is important to note that the Union National Bank had the best customer deposits to assets ratio amongst all other banks in 2008, 2009, 2010, 2011, and 2015, whereas Commercial Bank of Dubai beat the list in 2014, 2013, and 2012. On average, the First Gulf Bank did better than Emirates NBD and Abu Dhabi Commercial Bank, but indeed, there is a scope for further development for all three banks:
Equity and customers’ deposits to assets ratio
This ratio assesses the potency of a financial institution in terms of funding in order to understand whether the business is dependent upon external funding or not, and this is important because financial institutions that completely depend upon equity and deposits indicate the fact that they are not capable of lifting finances from their corporate activities. From such a point of view, it can be argued that banks like Emirates NBD and Abu Dhabi Commercial Bank are capable of lifting funds from the market, and they are not heavily dependent on customer deposits. However, this may not be safe for these two banks in the long run because many analysts argue that equities and deposits are the safest possible funding, and so a financial institution is potent if it does not depend heavily on market funding; therefore, as the graph below illustrates, throughout the eight years, Union National Bank was the most successful bank. The Union National Bank mostly relied on customer deposits more than any other banks in 2015, 2011, 2010, 2009, and 2008, whereas the Commercial Bank of Dubai beat the list in 2014, 2013, and 2012. The average performer, First Gulf Bank, also depends more on customer deposits, but it has the ability to raise funds from the market as well:

Loan to asset ratio
It is notable that a higher loan to asset ratio means more financial threats for the banks; as a result, corporations with a low loan to asset ratio are more stable economically. The banks that have low loan to asset ratio are demonstrated in the chart below; it is apparent that in 2008 and 2009, Emirates NBD had the lowest ratio, while in 2010, 2014, 2013, 2011, and 2012 First Gulf Bank had the lowest ratio. On the other hand, in 2014 and 2015 Union National Bank and Abu Dhabi Commercial Bank occupied the best positions respectively by significantly lowering the loan to asset ratio:
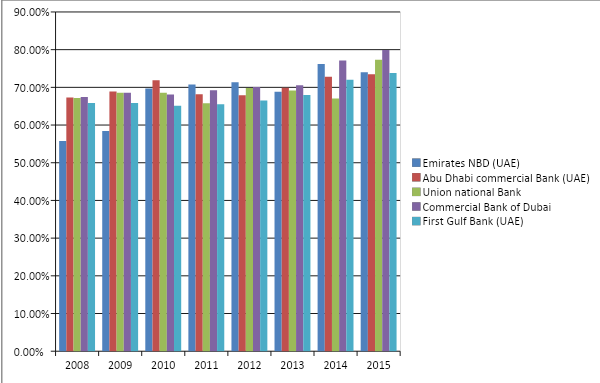
Loan to deposits ratio
This is a very important indicator for the financial institutions because there should always be a balance in this ratio; for example, an elevated ratio tells that the financial institutions lack adequate liquidity to face any unanticipated monetary necessities, and a low ratio tells that the financial institutions failed to earn sufficiently using their full proficiency. It is perceivable from the graph that Abu Dhabi Commercial Bank and Emirates NBD lack sufficient liquidity to face any monetary needs, whereas Union National Bank failed to utilize its proficiency to earn sufficiently. However, the First Gulf Bank and the Commercial Bank of Dubai maintained a well-balanced loan to deposits ratio, indicating their lucrative financial positions:
Recommendations and Conclusion
It is perceivable from this report that First Gulf Bank possesses the most lucrative ratios in comparison to the rest of the banks; as a result, most people will find this bank as an attractive investment area. However, the equity and customers’ deposits to assets ratios indicate that the First Gulf Bank relies more on market funding rather than customers’ deposits, and the bank should resolve this issue as soon as possible to ensure internal security. Commercial Bank of Dubai and Union National Bank performed quite well in some years, but failed to maintain consistency; so, these banks should focus on the strategies they used in their successful years and adopt those in long run. Conversely, Emirates NBD and Abu Dhabi Commercial Bank should make extensive changes in their financial strategies in order to recover from the weak ratios.
Works Cited
Abu Dhabi Commercial Bank 2016, “ADCB at A Glance”. ADCB Online. Web.
Commercial Bank of Dubai 2015, Annual Report 2015 of Commercial Bank of Dubai. PDF file. Web.
Cunningham, Andrew 2014, GCC Commercial Bank Performance Rankings 2014. PDF file. Web.
Emirates NBD 2016, “About Emirates NBD”. Emirates NBD Online. Web.
First Gulf Bank 2015, Annual Report 2015. PDF file. Web.
Union National Bank 2015, Annual Report 2015. PDF file. Web.
