The concept “time value of money” is based on the principle that an amount of funds costs more at the current moment than it may cost in the future because money can be invested and bring profit (Lane, 2017). This concept lays the foundation for the economic appraisal of investment projects’ effectiveness. Since investment activities are distributed over time, it is a common practice to compare the price of capital at the initial stage of investment with the value of potential future profits. The most important index showing the absolute effectiveness of investment is net present value (NPV). The given analytical method employs the time value of money, and if the investments in the project realization are made at several intervals, the calculation of NPV helps to identify the difference between the value of costs and profits.
In capital budgeting decisions, NPV is regarded as an absolute measure. However, some other analytical methods exist as well. In this paper, along with NPV, we will review such valuation tools as Internal Investment Rate (IIR) and Payback Period (PBP). Afterward, we will contrast them and evaluate pros and cons associated with the three methods.
Net Present Value: Description of the Concept
The method to be analyzed represents one of the approaches toward the economic analysis of intended investments’ effectiveness based on discounted cash flows. NPV of an investment project is the present value of net cash flows associated with a project minus initial investments required for its realization. To calculate NPV, managers need to know the magnitude and timing of capital investment, the operating cash flows, the rate of discount, and the project cessation costs (Ryan, 2007). An NPV formula may be represented as following:
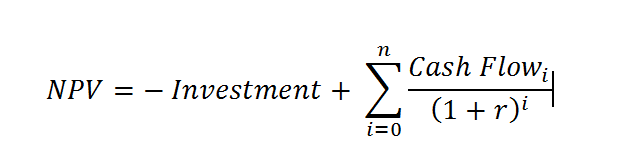
In the case where the present value of the analyzed investment project is not less than zero, the project can be accepted (Van Horne and Wachowicz, 2008). Otherwise, it is rejected. Additionally, the project can be approved if the present value of cash flows exceeds the present value of costs. The basis for the two acceptance criteria is as follows: If the required minimum rate of return determines the rate of return that, according to investors, the company can provide in the case of the proposed investment project realization, and the company accepts the offer under which the net present value is greater than zero, then the market value of its shares should rise. It is suggested that if the required minimum rate of return is correct, the total market price of the company shares should be changed by a value equal to the net present value offered by the investment project (Van Horne and Wachowicz, 2008). At the same time, the realization of a project associated with the net present value equal to zero should not affect the market price of the firm’s shares.
Internal Rate of Return: Brief Description
Like NPV, IRR is a discounted cash flow method that reflects capital market laws and allows analysts to estimate the loss of profits on the choice of a particular way of using resources, i.e., the economic value of resources (Discounted Cash Flow Methods). IRR is meant to determine the maximum cost of capital with which the investment project remains profitable. In other words, it is the average return on invested capital as provided by the investment project. This means that the effectiveness of capital investments in the project is equal to the effectiveness of the investment under the IRR interest in any financial instrument with a uniform income (Van Horne and Wachowicz, 2008).
IRR is calculated as the value of the discount rate at which NPV = 0 (Schmidt, 2013). As a rule, analysts use graphical methods to find IRR values. For example, they may build charts showing the dependence of NPV on the discount rate. To facilitate the procedure, it is possible to use specialized programs and MS Excel.
In general, the IRR formula for any investment project may be represented as following:
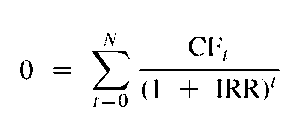
In the IRR formula, CFt is the value of cash flows in a particular moment of time (t), while n is the number of periods, and IRR is the internal norm of profitability. Organizations should pay attention to the fact that, in comparison to NPV, IRR analysis can be implemented merely when one of the cash flows has a negative value (Schmidt, 2015). This negative cash flow represents an initial investment. Otherwise, it is impossible to reduce NPV to 0. However, it may be hard to obtain a correct IRR result when using NPV = 0 with particular CF values; this equation may have several solutions or not have any (Merna and Al-Thani, 2008). In such situations, the IRR of the project is considered uncertain.
The normal acceptability criterion for the IRR method is the comparison of the internal return on investment with a predetermined threshold value (rate cut) or the minimum rate of return required for the approval of the investment project (hurdle rate) (Van Horne and Wachowicz, 2008). If the IRR exceeds the minimal rate of return, the project is accepted. Otherwise, it is rejected.
The minimal rate of return is usually externally defined. It is suggested that if the required minimum rate of return coincides with the shareholders’ expectations regarding the profits associated with an intended investment project, the acceptance of the project in which the IRR value exceeds this minimum rate of return will lead to an increase in the market price of the company’s shares (Van Horne and Wachowicz, 2008). This means that the firm accepts a project with a profitability rate that exceeds the rate needed for the maintenance of the current market prices of its shares.
Payback Period: Brief Description
The PBP method helps to calculate the period within which the organization will pay back its initial investments in a new project. This analytical tool is efficient in cases where the time needed for their realization is similar in all the compared projects; all projects imply non-recurrent investments, and the annual cash flows that are available throughout the duration of the project will be approximately equal (Al Ani, 2015).
PBP calculations are usually carried out in a few steps. First, the management should sum up the cash flows that emerge after the initial expense in the column “cumulative cash flows,” then analyze it and identify the last year when the accumulated sum will not exceed the amount of the initial costs. The third step is the calculation of the additional part of the cash flow that will be available the next year and which is required to cover and return the initial investments (Van Horne and Wachowicz, 2008). Overall, the PBP formula appears as follows:
PBP = a + (b – c)/d
The accumulated amount received on the second step of the PBP analysis is deducted from the initial investments, and the result is divided by the next year cash flows. Finally, to identify the payback period during a year, the analysts should take the whole number obtained on the second phase of PBP estimation and add it to the fractional part of the year that was defined in a previous stage (Van Horne and Wachowicz, 2008).
According to this method, the project is accepted in the case where the calculated PBP is less than the maximum admissible period of payback (Van Horne and Wachowicz, 2008). Otherwise, it is rejected.
Advantages and Disadvantages of Analytical Methods
As a method for the identification of the difference between the sum of the discounted cash flows generated as a result of project implementation and the discounted present value of all costs, NPV has several advantages. First, it allows analysts to take into account the alternative costs of the resources used, and consider not merely nominal accounting values but actual cash flows. This means that the estimation of investment projects is carried out from the perspective of an investor and does not depend on accounting policies (Chakraborty, 2004). The NPV method helps in evaluating projects based on the goal of ensuring the welfare of enterprise owners.
Compared to NPV, the PBP method is characterized by the simplicity of calculations. The method complies with the common principles of accounting, and as a result, it is easy to understand the initial information. Nevertheless, the lack of a link to the cash flow information is one of the major disadvantages to using PBP. Moreover, according to the principles of PBP, investments are made only for the generation of profits exceeding the costs (Kalyebara and Islam, 2014). This means that the criterion of payback shows when the investor may return the spent amounts but does not say anything about what profit the project may bring beyond the expected payback period. For this reason, the investment offering with the shorter payback period may be preferable to the variant that may bring a higher total income. Additionally, PBP does not let analysts consider the risks in a direct way—the difference between the duration of any project’s life cycle and the term of payback is merely a leeway for making the project profitable. It also does not allow taking into account the alternative costs of the required resources. Researchers observe that PBP is characterized by a high level of non-additivity (Kalyebara and Islam, 2014). It just helps to sum the cash flows without considering their distribution over time. Based on all the mentioned disadvantages of the method, it is possible to say that it provides a subjective and generalized evaluation of investment projects.
In circumstances when a decision about the approval of an investment project does not depend on specific internal or external limitations on the investment budget, NPV and IRR can be efficient. The right interpretation of project indexes ensures the possibility that investment ranking based on these two methods may lead to similar results (Keown, Martin, Petty and Scott Jr., 2004). However, ranking on different criteria may frequently lead to a different ordering of projects during analysis. The reason for this is that NPV is an absolute index while IRR is a subjective one. To understand the difference between the tools’ features, we will evaluate them in the context of mutually exclusive investments.
The extreme case of mutual exclusion emerges when the realization of one project makes it impossible to earn income from other investments. This type of investment is quite common, and very often NPV and IRR rank one set of mutually exclusive investments differently (Kalhoefer, 2010). Let us take a look at the following example:
If projects A and B are analyzed separately, each of them should be approved because both of them meet the acceptance criteria. Nevertheless, if these projects are regarded as alternatives, the choice is not clear because Project A has a higher NPV index, while Project B should be preferred according to its IRR index. In situations like this, it can be suggested to select the alternative with a higher NPV because the index characterizes the economic potential of the enterprise growth, and an increase in economic power represents one of the strategic priorities of almost every business (Kalhoefer, 2010). Along with this, it is important to consider the economies of scale, ignored in the IRR method (Advantages and disadvantages of IRR and NPV, 2017).
According to recent research, NPV is the more preferable project acceptance criterion because it meets the major goal of project realization (growth of economic potential) and is associated with a significant degree of adaptivity that allows management to sum NPV indexes calculated for various projects and use the aggregated value for the optimization of the investment portfolio (Kabachenko, 2015). In contrast, IRR has some serious flaws. First, in the comparative analysis of two alternative projects, the IRR criterion can be used rather arbitrarily. For instance, if the calculation of IRR for two projects shows that the index for Project A is higher than for Project B, then, in a certain sense, it means that the first project can be considered more acceptable because it allows greater flexibility in an investment source’s variability. However, such a preference is highly conditional. Due to the conditional nature of IRR, it is challenging to come to the right conclusions about mutually exclusive investments based on this calculation, as the possible contribution to the economic growth of the enterprise is not estimated. The given flaw is especially apparent in the case where the projects significantly differ in their cash flow values:
Project A may seem to be preferable because its IRR is significantly higher than that of Project B. At the same time, if an organization has an opportunity to finance Project B, then it should be accepted because its realization will support the firm’s economic growth much more than the implementation of Project A.
IRR merely demonstrates the maximum level of expenses that may be associated with an analyzed project. In particular, if the cost of investments in both of the alternative projects is less than the IRR indexes, the choice can be made only by adding more analysis criteria. Moreover, IRR does not allow discernment in situations when the price of the capital changes (Kabachenko, 2015). To understand the difference between IRR and NPV, we will evaluate the following example:
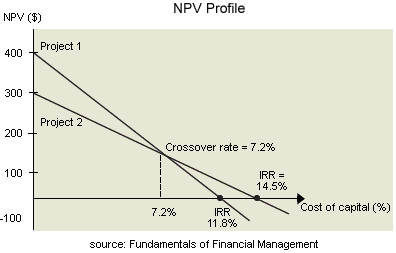
The intersection point shows the value of the discount coefficient in which both projects have the same NPV (in the example, it equals 150). This crossover rate is also called Fisher’s intersection–it serves as the border point separating the situations that are caught by NPV and not captured by IRR (Illes, 2014). Sometimes, the IRR criterion does not merely fail to set priorities between projects but also does not show the difference between situations when the discount rate is greater than or less than Fisher’s intersection. NPV, on the contrary, helps to set the right priorities in all circumstances. The project should be approved in the case where the discount rate is higher than Fisher’s rate (Illes, 2014).
A similar situation can be observed for economies of scale. The analysis of this category shows that the ranking outcomes in the evaluation of mutually exclusive investments are less credible for IRR than NPV (Advantages and disadvantages of IRR and NPV, 2017). The following example will help us to illustrate this argument:
Discount Rate = 10%
Based on the IRR acceptance criterion, Project A is preferable. However, when taking into account the effect of scale, we may see that Project B requires an additional 5.000 and provides a profit of 5.700. The IRR equals 14% (5700/5000 = 1.14 which also equals Fisher’s rate). This is the investment capability of the enterprise if it will be able to attract extra resources under 10%. When investing capital in Project A, managers may save 5.000, and this amount will bring 5.500 at 10% profitability per annum. The value is lower than 5.700, which can be received by investing extra resources in Project B. Therefore, the second project should be preferred if the discount rate is lower than 14%. The example makes it clear that analysts should always consider the size of investments.
Summary/Conclusion
Since the PBP method is associated with multiple flaws, the discounted cash flow methods, such as NPV and IRR, help to evaluate investment projects from a more objective perspective. These tools take into account both the amount of the expected flows and their distribution in time (during each period of the project’s life cycle). Since investors prefer to realize those projects that may bring profitability in a shorter period than those that will bring similar results over longer periods, the consideration of time value of money is important for decision making. In general, discounted cash flow methods help analysts determine the difference between the distribution of cash flows over time for various investment projects. In addition, by selecting a discounted value or the minimum rate on return required for the approval of a project, it becomes possible to consider the risks associated with projects.
Based on the analysis results and findings of the literature review, it is possible to conclude that the NPV method is more efficient for extraordinary investment flows as it is highly adaptable. When there is a need to choose between alternative projects, it can be recommended to accept the one with a higher NPV index. IRR also can be used to appraise mutually exclusive investments, but the CF values of the projects should necessarily be similar. Overall, in some ways, IRR calculations are easier, but the method may often lead to uncertain results. In a case where the price of the capital changes over time, it is better to use NPV.
Reference List
Advantages and Disadvantages of IRR and NPV, (2017). Assignment Help. Web.
Al Ani, M. K. (2015). A Strategic Framework to Use Payback Period (PBP) in Evaluating the Capital Budgeting in Energy and Oil and Gas Sectors in Oman. International Journal of Economics and Financial Issues, [online] Volume 5(2), pp. 469-475. Web.
Beine, G. (2016). Die Product Owner Toolbox. Web.
Chakraborty, S. K. (2014). Cost Accounting And Financial Management (For C.A. Course-1). New Delhi: New Age International.
Discounted Cash Flow Methods – NPV v/s IRR, (n.d.). Simplilearn. Web.
Illes, M. (2014). Fisher’s Rate and Aggregate Capital Needs in Investment Decisions. ‘Club of Economics in Miskolc’ TMP, Web.
Kabachenko, D. (2015). Improving the Assessment Effectiveness Methods of Innovative Industrial Leading Ukrainian Companies Activity. In: V. Bondarenko, G. Pivnyak, and L. Kovalevska, eds., Theoretical and Practical Solutions of Mineral Resources Mining. Boca Raton: CRC Press, pp. 353-361.
Kalhoefer, C. (2010). Ranking of Mutually Exclusive Investment Projects – How Cash Flow Differences Can Solve the Ranking Problem. Investment Management and Financial Innovations, [online] Volume 7(2), pp. 81-86. Web.
Kalyebara, B., and Islam, S. M. (2014). Corporate Governance, Capital Markets, and Capital Budgeting: An Integrated Approach. Berlin: Physica-Verlag.
Lane, M. (2017). The Time Value of Money. Web.
Merna, T., and Al-Thani, F. (2008). Corporate Risk Management. West Sussex: John Wiley & Sons.
Ryan, B. (2007). Corporate Finance and Valuation. London: Thomson Learning.
Schmidt, R. (2013). Understanding the Difference Between NPV vs IRR. Web.
Schmidt, R. (2015). What is NPV and How Does It Work?. Web.
The NPV Profile, (n.d.). Investopedia. Web.
Van Horne, J., and Wachowicz, J. M. (2008). Fundamentals of Financial Management. Essex: Pearson Education.
