The four main types of the market structure include perfect competition, monopolistic competition, oligopoly, and monopoly. There are different economic structures that an economy can adopt, but the four main structures are the perfect competition, monopoly, oligopoly, and monopolistic competition. These structures of economies exist in the real world, except for the perfect competition which is ideal and is hard to find. The UK electricity department has its structure as well. It is dominated by the top six suppliers. These suppliers have the advantage of having clients since the economy is rigid for new suppliers to penetrate.
The perfect competition is characterized by a population of businesses that offer the same products and services. There is no firm that the clients favour, rather the equalization of the businesses grounds it for the clients. Such an economy has the following assumptions attached to it: there is no customer preferred firm, the businesses offer the same products, and the suppliers optimize their profits to the same level. Similarly, there is a free exit and entry into the business. The firms compete between one another to optimize their sales and profit. There is no individual firm that has higher sales or consumer preference, hence they lack the economic power to attract more clients and stand out from the other businesses. Such kind of economic structure is somewhat ideal and hard to find in the real world.
Monopolistic competition defines an economy where many individual firms compete against each other. Unlike the perfect competition where the firms offer similar products, the monopolistic competition differs in the products they offer. However, the products are similar, but the slight variation between them provides a slight degree of economic power. The firms have the control over the rise and fall in prices, and these changes are transparent to the consumers. There are 3 assumptions in the structure: the firms maximize their profit and consumers have the freedom of preferring some products over others, the market is open for a free entry and exit for businesses and the products are not the same. A perfect example is the cereal market where there are different products of the same kind, and each product has its own consumers.
Oligopoly, on the other hand, is an economy in which a few firms in the market dominate the economy. These few firms have the overall power over the economy and often collaborate or compete for a maximum sale. In the oligopoly, the products may be similar or different, and the dominants create barriers to the free entry into the economy. The price of the products or services is wholly dependent on the firms. Consumers have no choice but to comply with the demands of the suppliers (Rosenberg & O’Halloran 2014). An example of the oligopoly is the gaming industry which has three companies only. Sony, Microsoft and Nintendo own the market.
A monopoly is a single firm in the business. It has no competition from any other business and hence has the maximum market power. A monopoly reduces the production of products so that it can increase its profit. It has the liberty of setting prices, as the consumers have no other alternative. The company also sets very high barriers for entry and exit into the economy (Abd. Kadir et al. 2014).
In the UK the big six companies dominate the energy sector taking up ninety percent of the total energy economy. British Gas is the largest energy company operating in Scotland. The others are Npower, SSE, Scottish Power, EOn, and EDF. British Gas is a part of the British-owned Centrica Group and makes profit of over six hundred million euros per year (OVO Energy 2014). It offers employment to over three thousand residents in the UK and it is the largest company among the big six. British Gas started supplying electricity a year after its establishment and has since then merged with other small companies with the vision of a large company as it stands today. It has a big range in the determination of prices. Just as other companies, British Gas increases the quality of its services so that it can increase the price.
NPower is a part of the German Power Giant (RWE) and is one of the largest European Energy suppliers. It has the largest dual-fuel bills and makes an annual profit of over four hundred million euros. SSE makes over three thousand million euros out of the domestic supply of power. E On makes three hundred million euros annually from the domestic power supply. The UK has an oligopoly market structure where six energy companies dominate the industry while the rest lie at the bottom. These companies compete for the supply of power and mostly determine the prices of power and energy products. The British Gas is a major supplier with thirty percent of the total domestic consumers. Over the years, however, the supply has reduced since consumers now prefer dual- fuel supply from the same consumer. E On is another major supplier which has seen a gradual increase from 2011 to 2014, then shoot up again as clients could receive dual- fuel services from it.
The companies have been in play for many years as the market gets more rigid and harder for small markets to penetrate. The smaller markets such as OVO, however, have received several awards based on the quality of services they offer, hence encouraging clients to peep into these smaller companies. It is evident that the smaller companies are in a position to offer the same services, or even better than the big six. Smaller companies work by small fixed prices, which the households may take advantage of. The households can switch users so that to receive the cheap and swift services offered by the smaller companies. The big companies, on the other hand, work by variable tariffs which are dependent on demand, supplier companies and cost of purchasing and supplying the oil and electricity. Such factors, together with the dominance of a few companies, make the market have unstable and ever rising prices.
Economic Theories for Profit Maximization
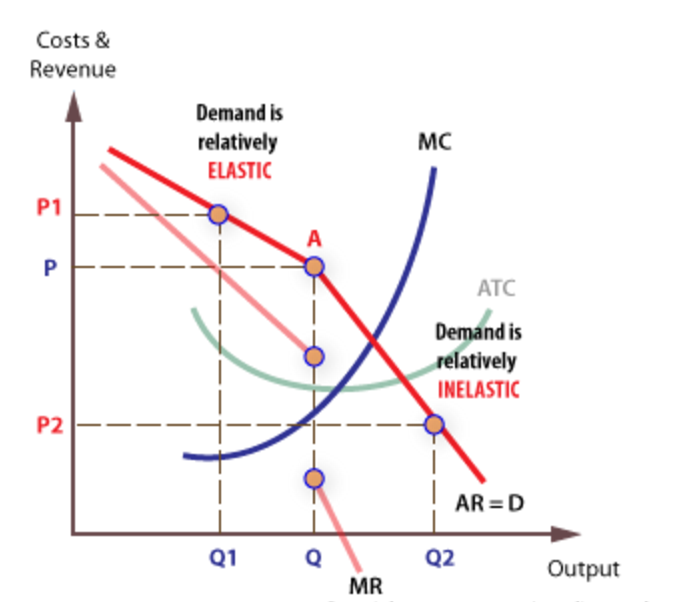
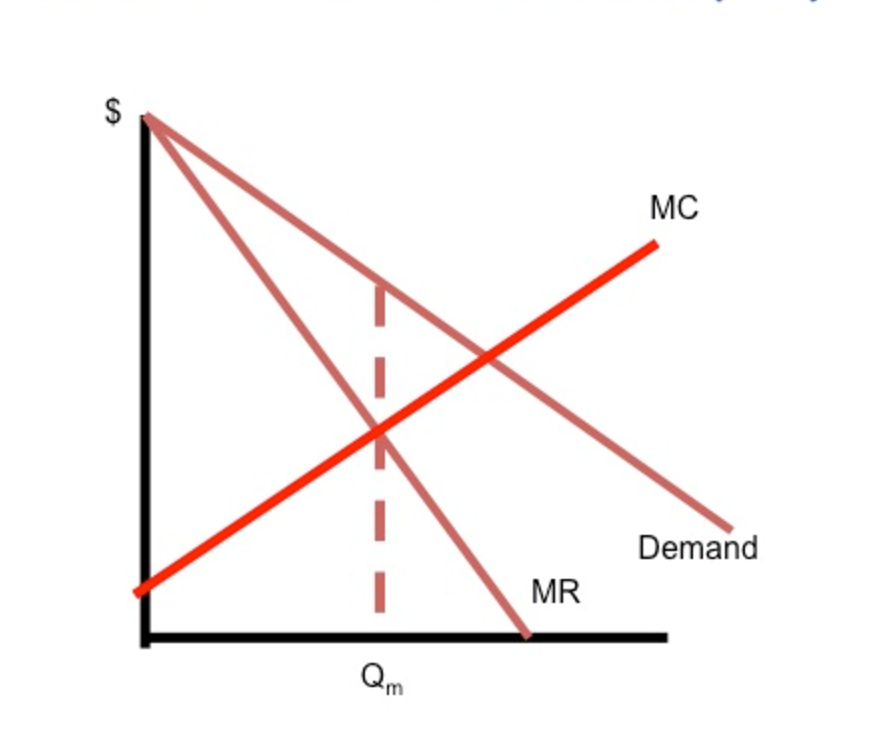
The Gas Company is a typical oligopoly firm operating under a non-collusive environment. In this regard, a kinked demand curve is likely to be used for the calculation of the optimal profits. Under this scenario, the firm is likely to sell its products at the market equilibrium price (Rosenberg & O’Halloran 2014). The optimal production level for profit maximization is when marginal revenue is equivalent to marginal cost and, in this case, it should be along the equilibrium price determined by the kinked demand curve. Abnormal profits will be made in the case of collusion with other firms. In this case, the company will behave like a monopolistic venture.
In the case of energy, the prices charged on the different energy products vary. Similarly, the firms supplying the energy do not charge equally as in the case of perfect competition structure (Golub 2013). Another factor is the quality of the product or service; the better quality products attract clients more than the low-quality ones. The amount of money the consumer earns also determines the kind of product they buy. The case applies to energy products. The British Gas company has a majority of clients and has expounded on its products so as to reach more clients. On its website, the company explains all the reasons why a client has to choose it. For instance, one can pay for the products online anytime anywhere using their phones.
Since few companies dominate the energy market, the oil products have the prices fluctuations happen consistently. The prices are determined by the companies themselves, whether they work together or compete for clients. This happens when the companies improve the quality of their services and raise their prices. Others increase the convenience of accessing their services and assurance of full-time satisfaction. For instance, British Gas uses the tool of employment to receive clients from their firms. It has offered employment to thirty-three thousand domestic residents. Late last year, the company increased the price of all its products which included electricity, gas, and dual-fuel. The inclusion was the 8.4 increase in gas and electricity raised by 10.4 which averaged to 9.2% increase in prices.
The market mechanism states that all stakeholders involved have the power to determine the prices of products. The companies compete for sales whereas the consumers choose the products of their preference. High prices work to the advantage of the producer while low prices work to the advantage of the consumers. When the prices are high, the consumer is discouraged from buying while the producer is motivated to manufacture more. On the other hand, low prices encourage consumers and discourage producers. There is no specific producer or consumer who sets prices, and the government has no power to set prices of products as well. The demand and supply model is the key factor that determines the prices of products. The demand model is the ability of a consumer to afford the good that he/she desires. Supply is the ability of the manufacturer to be able to make his/her products accessible to the consumer. Hence, not everyone in the market can act as a supplier or consumer. Market demand is the average demand of the consumer for certain products that the supplier provides.
The British Gas company understands the demand for energy products it offers. Hence, it has taken into account the possibility of increasing its profit by raising the prices. The prices of electricity and gas have been increasing over the past few years. The demand is high since the economy is characterized by only a few companies who compete against one another. The regulator to the price fluctuations is the competition which offers opportunities for individual companies to set prices. There is economic efficiency in the UK energy sector. The economy is on a good level since there is enough supply of the products that the consumer requires.
Flexibility in Changing Energy Suppliers
Customer satisfaction is the main driving force that makes consumers stick to one supplier. For decades, most households in the UK have been supplied by the same suppliers. The services offered are almost the same, and hence the households prefer standing with what is already at hand. The other reason is that energy is the same. The product has similar if not identical services. For example, electricity from British Gas is similar to all the other suppliers; hence changing supplier does not add any value to the consumer. Similarly, the companies are all working hard to ensure they provide optimum quality products and services. The individual companies have similar features in their model of operation. An example is the availability of Android apps where clients can pay bills, and receive services using their phones.
The customized credit card for payments is also a common feature among the suppliers. The big six companies have been dominating for several years and have, therefore, with time won the trust of the consumers. The prices rise every year among the big six companies and all of them have a similar rise; hence, the clients do not see the need to exchange suppliers. Switching suppliers might also be tedious in the cases where one owes to the current supplier.
Non- price approaches are the ideal approaches that could be used to encourage consumers to change the suppliers. Some of the non- price strategies include after sale services like free car engine wash, massive advertisement. Price leadership would be undesirable since it will only win customers in the short run. The customers will return to their original suppliers once the competitors reduce the prices.
The Impact of a Price Cap in the Energy Market: Advantages and Disadvantages
The conservative party promises to set a cap on the standard variable tariffs. This comes in place with the alternate idea to reduce the difference between the set fixed prices and the variables. The idea is to ensure that British economy remains internationally competitive. The cap will also help the small suppliers have a place in the market and increase the number of consumers they have. Politicians are penetrating the market since consumers have stuck to their old suppliers despite many new and better companies getting into the market. The concern is that the suppliers will take advantage of the loyal clients and overcharge them (Ambrose 2017).
One of the main advantages is the stabilization of the oil market prices. Fluctuations mainly affect the producers, where a drastic decrease in oil prices occurs when they are holding high inventories. In such cases, it is almost inevitable to make net losses. In this case, the new law, which will be fully implemented in 2018, may cause a decrease in sales revenues. The market will also reduce the rigidness and become open for a free entry and exit. That means the status and superiority will reduce.
In the manifesto, the switch in energy policies has been put into consideration, and all the policies to be made have been strategically planned. The penetration of the government will ensure stabilization of the market and will reduce exploitation of the big companies. It is time the households realized that they can receive equal or even better services from any other small companies, who have recently seen stabilization in the quality of services they offer.
Pound’s exchange rate impact on the UK economy
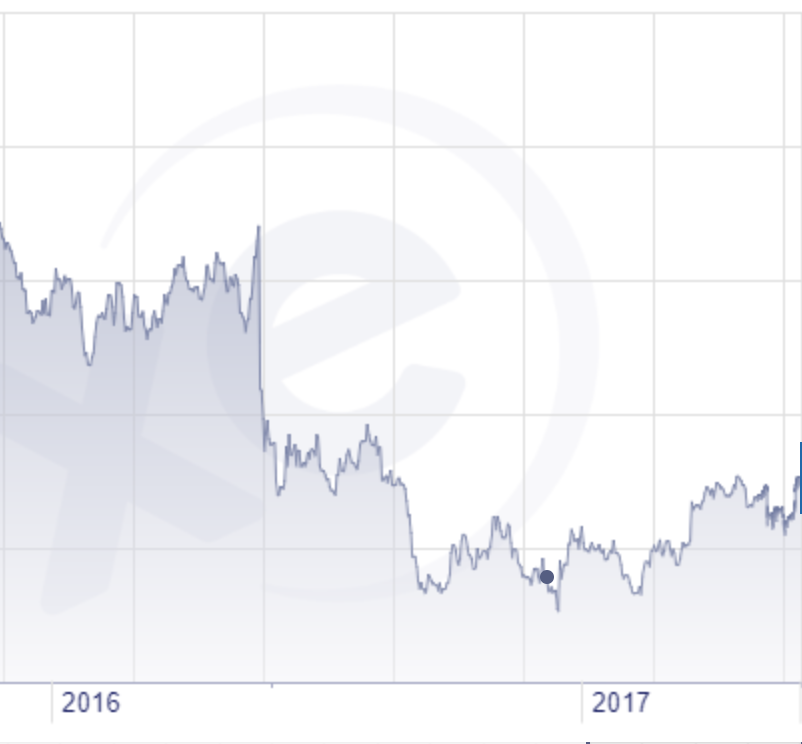
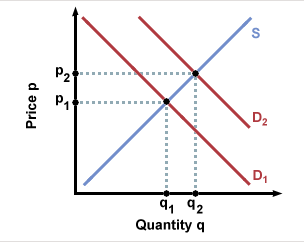
In 2016, the pound was consistently weakening against the dollar. The Brexit Ripple was the main cause of pound crush that was experienced in the UK. The Brexit mainly advocated for the UK to exit the European Union. In this regard, the exit locked the United Kingdom out of the European market. Consequently, many European firms stopped doing business in the UK. The decrease in the number of European firms who had businesses in the UK caused the decrease in the demand for the local currency. Lower demand caused the crush in the pound exchange rates, hence weakening of the British pound against other foreign currencies, including the US dollar. Precisely, there was a shift to the left in the demand curve due to the decrease in foreign economic activities in Britain, as a result of the Brexit campaign.
The Competition and Management Authority (CMA) on the other hand says that the market will remain flexible and open to all the suppliers. The cap is placed on the big companies that switch prices when they want, especially during the recent years. It is also aimed at increasing the number of suppliers by encouraging the clients to switch companies to receive more quality services. The new prices will ensure that the loyal clients are rewarded, and the advantage of switching users will be evident,
The price of energy in Britain increased due to the weakening of the pound. Inflation happens as a currency devalues. For years, the energy sectors have used the euro in selling its products. There has been the introduction of the dollar as the medium of exchange in the energy sector. The use of the dollar is aimed at standardizing the sale of the oil products. The dollar has seen a rise in the sale of energy. In this case, a drop in the value of the British pound implies that more pounds will be needed to obtain the energy in euros/ dollars. More pounds mean an increase in prices of fuel.
To sum up, in oligopoly, the products may be similar or different, and the dominants create a barrier for a free entry into the economy. The prices of the products or services are wholly dependent on the firms. Consumers have no choice but to comply with the demands of the suppliers. The energy sector has a major share in the whole economy in the UK. Energy is the determinant of progress or regress of an economy (Bloch, Eaton & Rothschield 2014).
Reference List
Abd. Kadir, H, Habibullah, MS, Law, SH & Mohamed, A 2014, ‘Market structure and bank competition conditions in Malaysia’, Journal of Technology Management & Business, vol. 1, no. 2, pp. 1-34.
Ambrose, J 2017, The new energy price cap con? Web.
Bloch, H, Eaton, BC & Rothschild, R 2014, ‘A dynamic model of oligopolistic market structure, featuring positioning investments’, International Journal of the Economics of Business, vol. 21, no. 3, pp. 379-411. Economics Online, 2017. Market Equilibrium, Web.
Golub, SS 2013, ‘Oil prices and exchange rates’, The Economic Journal, vol. 93, no. 371, pp. 576-593.
Expense Reduction Analyst, 2017. Energy Market Report, Web.
OVO Energy 2014, A beginner’s guide to the Big Six energy companies, Web.
Rosenberg, S & O’Halloran, P 2014, ‘Firm behavior in oligopolistic markets: evidence from a business simulation game’, Journal of Business Case Studies, vol. 10, no. 3, pp. 239-254.
