Introduction
The level of job satisfaction among employees determines performance of employees in an organization. Given the evidence that job satisfaction increases performance of employees, modern organizations strive to provide better working conditions and employment terms. Essentially, many factors determine the level of job satisfaction in an organization. Some factors are remuneration package, nature of job, type of management, age of employees, and the working conditions. The proper combination of these factors can enhance job satisfaction and consequently improve performance of employees. In this view, different organizations should determine factors that influence job satisfaction among employees so that they can gain insights on how to improve employees’ performance. To determine factors that determine job satisfaction, application of qualitative and qualitative research methods are essential. American Intellectual Union (AIU) performed quantitative and qualitative research, which examined nine factors, namely, gender, age, department, position, tenure, overall job satisfaction, extrinsic satisfaction, intrinsic satisfaction, and other employee benefits, which influence job satisfaction among employees. Analysis of the AIU data set provides insights of employees’ job satisfaction. Therefore, this essay analyzes job position and extrinsic elements of job satisfaction as qualitative and quantitative variables respectively.
Job Position
Job position is a qualitative data that the essay has selected for analysis. The job position is an important variable that determines job satisfaction because responsibilities, remuneration, and benefits vary according to the job position. Examination of the job position as a variable of job satisfaction is important in depicting whether the job position determines job satisfaction. In this case, the data set can depict if salaried employees and hourly employees have varied levels of job satisfaction due to their job position.
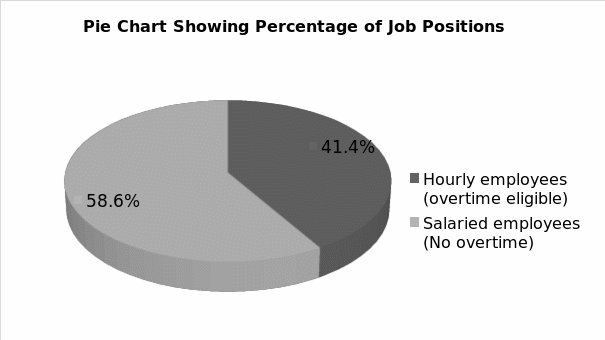
From the data, frequency table (figure 1) shows that salaried employees are 17 while hourly employees are 12. Comparatively, the observation indicates salaried employees are many when compared to the hourly employees.
Figure 1
Descriptive Statistics
The descriptive statistics (mean and median) is not appropriate in describing the job position of the employees because it is a qualitative data. Since there are only two categories of job position (hourly employees and salaried employees), a mean of the two job positions does not exist. An employee can be either a salaried employee or an hourly employee, but a mean category of the job position. Hence, mean does not provide statistically significant value. Moreover, the median is not necessary because a midway category is not relevant as in the case of mean. However, mode is appropriate in data analysis because it shows the most common job category among employees.
Given that job position is a qualitative data that exist in two categories, it does not provide robust data that standard deviation and variance can measure. Therefore, the dispersion measures are not applicable in the analysis of job position.
Pie Chart

The pie chart depicts proportion of employees in each job position in terms of percentages. The pie chart reveals that 58.6% of all employees are salaried employees. The use analysis of job position as a variable is important because it shows whether job position influences job satifaction.
Extrinsic Job Satisfaction
The essay also selected extrinsic job satisfaction as a variable that determines job satisfaction. The extrinsic job satisfaction includes factors like location of office, social environment, and infrastructure. The extrinsic job satisfaction is important because it depicts how social and physical environment influence job satisfaction among employees. By examining this data, one can see that an even distribution of responses exists among employees.
Figure 3
The table above provides descriptive statistics of the extrinsic factors that influence job satisfaction. Intrinsic scale of job satisfaction ranges from least satisfaction with scale of one to most satisfaction with a scale of seven. Descriptive statistics show that extrinsic satisfaction has a mean of 4.99, median of 5.4, and a mode of 6. The measures of central tendency depict that most employees gain job satisfaction from extrinsic factors such as the social and physical environment.
Concerning measures of dispersion, the job satisfaction has a standard deviation of 1.30 and variance of 1.67. The standard deviation and variance show that the values of extrinsic job satisfaction do not vary significantly from the mean.
Bar Graph

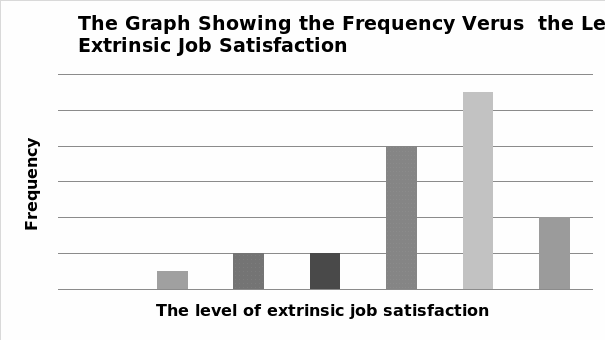
The above bar graph shows that there is skewed level of extrinsic job satisfaction. The skewed job satisfaction indicates that extrinsic factors increase job satisfaction. Representation of the analysis using bar graph enhances understanding of the extrinsic job satisfaction because the graph clearly depicts that increasing number of employees experience satisfaction due to extrinsic factors.
Conclusion
Study of job satisfaction among employees is essential because it enables human resource managers to improve their performance. Since a number of factors influence job satisfaction, organization should perform research and obtain valid data. Usually, researchers collect both qualitative and quantitative data when performing various research activities. Analysis of qualitative and quantitative data requires application of numerous statistical tools and measures. Measures of central tendency and dispersion provide robust descriptive statistics. In this case, descriptive statistics did show that salaried employment is the job position of most employees. Additionally, extrinsic factors enhance job satisfaction of considerable number of employees.
