An Overview of the Consumer Electronics Industry
Rapid technological development of humanity has predetermined the increasing relevance of the electronic industry or, in other words, consumer electronics. To begin with, it is necessary to find out what is taken by this kind of electronics. This definition means that all electronic devices used by society are divided into industrial, domestic, and electronic equipment. The purpose of household appliances is to simplify a person’s life in the house, and industrial devices are intended to facilitate production (Zysman & Tyson, 2019). In this case, electronic appliances carry out several functions not falling under one category.
This caused many ways in which the last type of electronic devices can develop and stay actual. To narrow the scope of the analyzed products, it should be noted that this study will consider computers, laptops, and phones. Each of these products, in addition to what should perform essential computing functions and help maintain contact with the public at a distance, gets more new features every year (Zysman & Tyson, 2019).
For example, phones get a camera, graphics editors, programming capabilities, and intelligent home controls. This explains phenomena such as the annual increase in price and frequent updates to product lines, which are typical of the industry in question. The aesthetic point of view is also worth mentioning, with developers and corporations striving to create powerful end products and competing in design (Zysman & Tyson, 2019). First, it also affects the price, following the rule “the more beautiful, the more expensive. And second, it attracts consumers, who tend to get used to the established style and want innovation. This industry is also characterized by high competitiveness (Zysman & Tyson, 2019). It is difficult to pass to the market for newcomers because of the following factors:
- The high cost of production;
- A vast market across the planet;
- Overwhelming credibility of other companies;
- A large number of solid competitors (Zysman & Tyson, 2019).
Because of the reasons mentioned above, it can be noticed that new brands in electrical equipment rarely appear.
Apple
Apple is an American corporation, and manufacturer of personal and tablet computers, audio players, phones, and software. The company is one of the pioneers of unique and modern multitasking operating systems with a graphical interface. The company was formally founded on April 1, 1976, by the union of Stephen Wozniak and Steve Jobs (Apple, 2021). The Apple II (released in 1977) was an absolute masterpiece (Apple, 2021). It was the first computer ever mass-produced by the company. Many other models of personal computers were based on it (for example, developments of the USSR were based precisely on the Apple II). This model was sold until the early 90s, with only minor changes in design. But the Apple III project (produced in 1980) proved to be a failure.
The result was a highly unreliable device prone to overheating. In addition, the rush in which it was assembled led to a drastic drop in quality. All of this led to the failure of the market. While Apple II was bringing money, the company was busy with new projects – Lisa and Macintosh, the main feature of which was the presence of a graphical interface, safely borrowed from Xerox (later, in the same way, MS Windows would appear). The Mac went on sale in 1984, preceded by a famous commercial, “1984”, directed by the famous Ridley Scott (Apple, 2021). The company quickly gained consumer confidence with the reliability and speed of technology, and with the advent of revolutionary touch screen phones has finally become the first in this area. The fact is that the capabilities, design, and spectacular and memorable advertising predisposed an overwhelming number of potential buyers (Apple, 2021). It is necessary to analyze what factors have allowed the company to achieve phenomenal success and gain a firm foothold.
Critical Success Factors for Apple
Marketing experts have analyzed the market for phones and computers and identified weaknesses in the niche, which they decided to turn into advantages and a business card company. The main success factors for the company were the following areas:
- Large financial capacity, which allows the company to be one step ahead of its competitors;
- Careful monitoring of demand on the digital market and the ability to quickly present to the consumer what he needs;
- A serious approach to business, which guarantees a high level of company reputation;
- The ability to select only highly professional employees to its staff;
- They are presenting any new product as relatively easy to use for the consumer and an element of the image of a person or company (Zysman & Tyson, 2019).
A separate item of the company’s expenses is advertising and promotion of the product. Throughout its history, Apple has only adhered to two strategies in its advertising messages, which can be briefly described as “Think Different” and “Screw the P.C.! We’re more comfortable.” Almost simultaneously with these commercials, Apple interested the public with arguably their most famous commercial, “1984,” which was officially shown only once, during the broadcast of the third quarter of the Super Bowl game on January 22, 1984 (Zysman & Tyson, 2019). Apple now owns more than 5,000 patents for inventions and designs, and Apple’s iPhone 5 sold 9,000,000 units in just three days after its first presentation (Statista, 2021a). This could be called the company’s most significant measure of success.
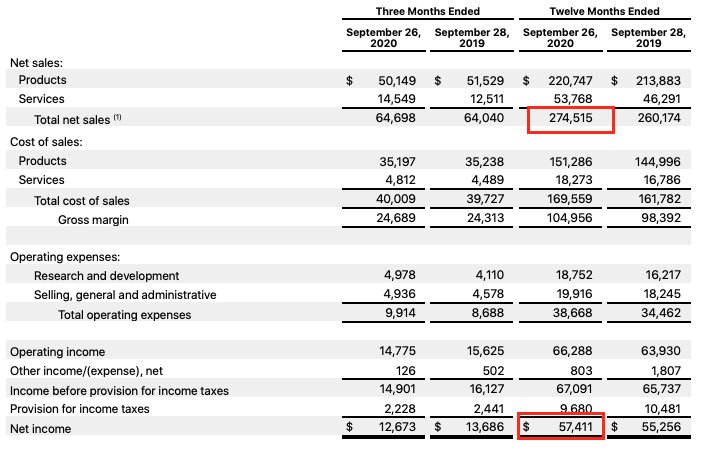
Finally, the company is characterized by the absorption of various companies working on the I.T. market, which does not give potential competitors and develops a staff of employees of Apple. Among the essential such deals are the acquisitions of NeXT (1996, $430 million), P.A. Semi (April 2008, $280 million), Quattro Wireless (January 2010, $274 million), Siri (April 2010, $200 million), Anobit Technologies (January 2012, $400-$500 million) (Zysman & Tyson, 2019). For fiscal 2020, Apple earned $274.52 billion in revenue compared to $260.17 billion a year earlier (Statista, 2021a). Product sales increased from $213.88 billion to $220.75 billion, and the service business (App Store, iCloud, iTunes, Apple Pay, etc.) went from $46.29 billion to $53.77 billion.
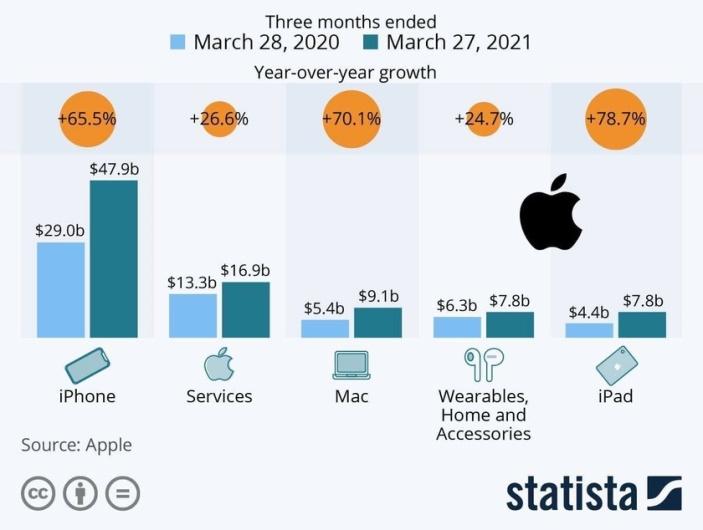
The primary source of income for Apple remains smartphones. Sales of iPhones in fiscal 2020 were $137.78 billion, down from $142.38 billion a year ago (Statista, 2021a). The decline was because users were waiting to release new models, but it was delayed because of the pandemic coronavirus COVID-19 (SAP, 2021). Apple CEO Tim Cook says interest in the company’s iPhone 5G line and other new devices has been “extremely positive.”
Trend & Ratio Analysis of Apple
Apple earned $274.52 billion in revenue in fiscal 2020, up from $260.17 billion a year earlier. Product sales increased from $213.88 billion to $220.75 billion, and the service business (App Store, iCloud, iTunes, Apple Pay, etc.) went from $46.29 billion to $53.77 billion. The primary source of income for Apple remains smartphones. Sales of iPhones in fiscal 2020 were $137.78 billion, down from $142.38 billion a year ago (SAP, 2021). The decline was because users were waiting to release new models, but it was delayed because of the pandemic coronavirus COVID-19. Computer shipments brought in $28.62 billion in annual revenue for Apple, up from $25.74 billion a year earlier (Apple, 2021). In the tablet market, its revenue climbed from $21.28 billion to $23.72 billion, and its wearable electronics, home gadgets, and accessories division registered sales growth from $24.48 billion to $30.62 billion.
As for the regions, the lion’s share of Apple’s sales is still in North and South America, where the corporation earned $124.56 billion in 2020 compared to $116.91 billion in 2019 (Zysman & Tyson, 2019). In Europe, sales also increased – from $60.29 billion to $68.64 billion. But in China, Apple’s revenue declined year over year (from $43.78 billion to $40.31 billion) and in Japan (from $21.51 billion to $21.42 billion).
On the day of the publication of its annual financial statements, Apple’s shares fell by 4.22% in electronic trading after the close of trading (Statista, 2021a). As a result, the company’s market capitalization in one day dropped by almost $100 billion. Quotes fell due to lower revenues in China, and those iPhone sales fell short of market expectations.
Thus, the general trends of the company can be called the following points:
- Annual increase in sales volume and profit of the company. Firstly, it is explained by the expansion of customer base, secondly, the addition of product value, and thirdly, improvement of products both technically and aesthetically, arousing interest. For example, one of the latest marketing moves made by the company was the introduction of several previously missing colors for the phones and after that, sales grew by 5%.
- The delay in launching new models is directly related to the company’s falling sales. According to the results of the second quarter of 2020, it is noticeable that iPhone sales declined due to the late release of new smartphones (Table 2).
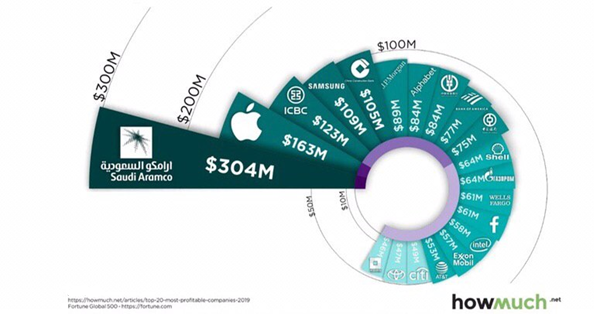
- The company is in the top 20 richest companies in the world for 2019. It continues to increase its profitability, which shows the trend of the brand development and maintains a prestigious place among competitors (Table 3).
Comparison with Samsung
For a more objective analysis of Apple’s performance, comparing the company with an equally powerful electronics competitor is necessary. Over the past decade, Samsung and Apple have repeatedly stood at the top of the global rankings of mobile device manufacturers. But they are very different companies, with very different approaches to what smartphones should be and how business should be done.
When were the companies founded
- Samsung: March 1, 1938, in Daegu, South Korea (Samsung Newsroom, 2021).
- Apple: April 1, 1976, Cupertino, California, USA (Apple, 2021).
Number of employees
- Samsung: 320,671 employees (as of December 2017) (Samsung Newsroom, 2021).
- Apple: 132,000 full-time employees (as of the end of the fiscal year 2018) (Statista, 2021a).
Market share
Samsung had the largest market share in the first quarter of 2018, while Apple had the largest market share in the fourth quarter of 2017 (Table 4).

Best selling phone
Samsung: E1100, 2009: 150 million units. Galaxy S4, 2013: 80 million units (Statista, 2021b).
Apple: iPhone 6 and iPhone 6s, 2014: 220 million units (Statista, 2021a).
Largest acquisition
Samsung: Harman International Industries, 2017: about $8 billion (Statista, 2021b).
Apple: Beats Electronics, 2014: about $3 billion (Statista, 2021a).
The value of the latest flagships released
Samsung:
- Galaxy S10: $899.;
- Galaxy S10 Plus: $999;
- Galaxy Note 9: $999;
- Galaxy S9: $719;
- Galaxy S9 Plus: $839 (Statista, 2021b).
Apple:
- iPhone XS: $999;
- iPhone XS Max: $1,099;
- iPhone XR: $749;
- iPhone X: $999;
- iPhone 8: $599;
- iPhone 8 Plus: $699 (Statista, 2021a).
Table 5. Recent earnings.
As a result of comparing some characteristics, the conclusion is that Apple’s campaign is more profitable than Samsung’s policies and activities in an overwhelming number of criteria. Firstly, Apple’s revenues have been consistently higher than Samsung’s in all three years (Table 5). Secondly, the staff of the American company is several times smaller than that of the Korean company, which suggests that Apple’s personnel costs are lower while its revenue is higher. This testifies to high professionalism and demanding recruitment criteria. Thirdly, Apple spends less but earns more compared to Samsung. This can be seen in the graph of the most significant devices, the slight difference in the cost of flagship products, and the percentage of market share.
Sensitivity analysis
The next billion smartphone and tablet users will be much more price-sensitive than the first billion. At the moment, the number of smartphone users has reached 1 billion, and 6 billion cell phones. Now the increase in the smartphone market will go at the expense of the less well-off people on the planet, so the price of the device will be more and more critical in the competition.
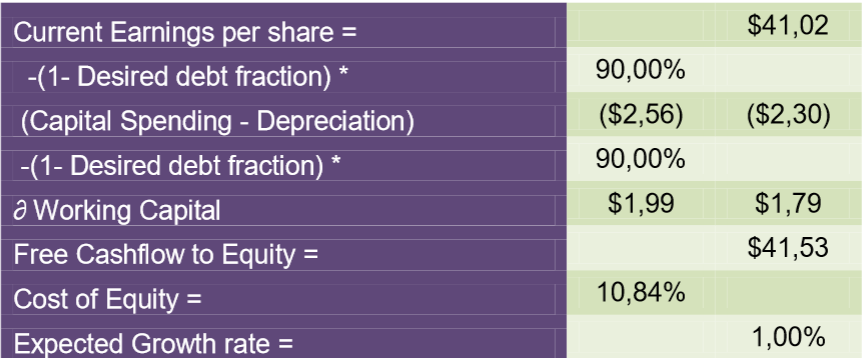
Expected free cash flow current earnings per share = $41.02 -(1- Desired Share of Debt) * 90.00% (Capital Outlay – Depreciation) ($2, 56) ($2.30) -(1- Desired Share of Debt) * 90.00% Working Capital $1.99 $1.79 Free Cash Flow to Equity = $41.53 Cost of Equity = 10.84% Expected Growth Rate = 1.00% (SAP, 2021).
Table 7. Stock valuation.
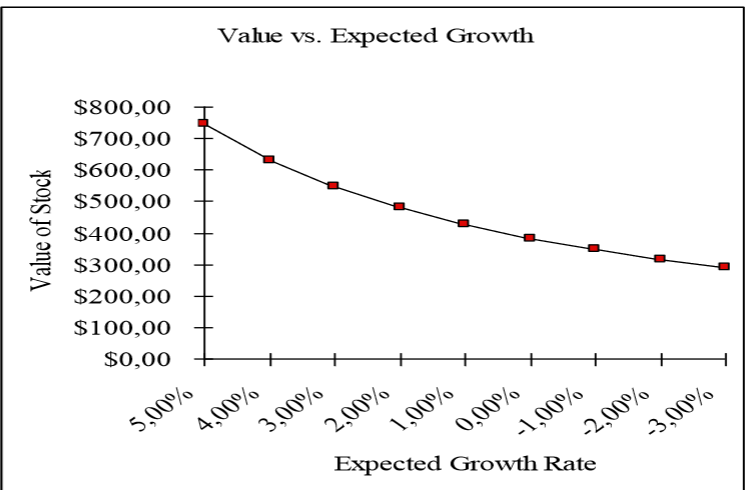
The sensitivity analysis of the change in the cost of equity to the growth rate in a stable period is shown in Fig. 1. The cost of capital remains unchanged.
In summary, the conclusion is that Apple’s sensitivity has not changed. Even though the first billion phones have been sold, and in theory, the actual consumer should switch to the less affluent segments of the world’s population, this will not happen. This is explained by the frequency of release of new products, the introduction of innovative technologies, and the stability of release dates that have contributed to changing the technology every year for a newer one. Apple’s policy also promotes it in exchange programs, the possibility to return within a year, and the environment protection course, the essence of which is to reduce the amount of discarded products from the company.
References
Apple. (2021). Apple newsroom. Web.
Howmuch. (2021). The largest brands of the world 2020. Web.
Samsung. (2021). Samsung newsroom. Web.
SAP. (2021). Products analytics overview. Web.
Statista. (2021a). Apple – statistics & facts. Web.
Statista. (2021b). Samsung Electronics – statistics & facts. Web.
Zysman, J., Tyson, L. (2019). American industry in international competition. Government policies and corporate strategies. Cornell University Press.
