Introduction
The stock market in Saudi Arabia was first formally regulated in 1984 (Al-Twaijry, 2006, p.2). In 1985 the Saudi Shares Registration company was inaugurated. The early 1990 saw the modernization of the market with introduction of an Electronic Securities Information System by the Saudi Arabian Monetary Agency (Al-Twaijry, 2006, p.2). Further reforms in the market to promote efficiency and fairness culminated in the establishment of the Saudi Stock Company (TAWADUL) in October 2001.
Saudi Arabia, stock exchange (Tawadul) is the largest in terms of market capitalization in the entire Arab region (Ulussever, Gurannyumusak & Kar, 2011, p.16). As of December 7, 2011, its market capitalization stands at $330 billion with a total of 148 listed companies up from 70 in 2002. These figure dwarfs that of its neighbors with the next largest, Kuwait Stock Exchange having a market cap of $ 94 billion. The Saudi Arabia Capital Markets Authority is currently the sole regulator of the bourse having taken over from Saudi Arabia Monetary Agency (SAMA) in 2003. To protect investors and promote fairness and efficiency most activities of the stock exchange were automated by the introduction of trading, settlement, clearing, depository and registration system in 2003. The robust trading system has greatly enhanced efficiency in trading (Euromoney, 2003). The main sectors of the Saudi Stock exchange are :banks & financial services, petrochemical industries, cement, retail, energy & utilities, agriculture & food industries, telecommunication & information technology, insurance, multi-investment ,industrial investment, building & construction, real estate development, transport, media & publishing and hotel & tourism.
Until the end of 2007, only Saudi nationals could trade in the country’s stock market. However with the formation of Gulf Countries Council (GCC), other GCC nationals have been allowed by the Saudi CMA to trade in Tawadul. The CMA also opened doors for more foreigners participation in August 2008 when it approved rules that allow share trading by non-Arabs although this required them to make swap arrangements with local CMA-approved and licensed intermediaries(SAMBA 2009). According to a 2009 data by Saudi American bank (SAMBA), the Saudi stock market is dominated by retail investors who account for about 88 percent of transactions that year. Saudi corporations and mutual funds account for 7.0 and 1.5 respectively. Foreigner’s stake in that year’s transactions was low with 1.2 and 0.2 for the non-resident and resident respectively.
This paper assesses the performance of the Saudi Stock market in the last decade (2001-2010). In the first section the performance of the first half of the decade is presented. This is followed an analysis of the market performance in the last half of the decade. Finally the performance of each sector is presented and basing on the findings, a conclusion is drawn.
Stock market performance from 2001-2006
After near stable performance in the first year of this decade, the Saudi stock market experienced unprecedented immense growth from 2004 peaking in February 2006 at an all-time high of 20,634 points. This growth represented a 150 percent jump from the highest 8,206 points of 2004 and a yearly growth of 230 percent since start of the decade. This is captured in the table below
Table 1. Graph of Index weekly behavior from 2001-2005
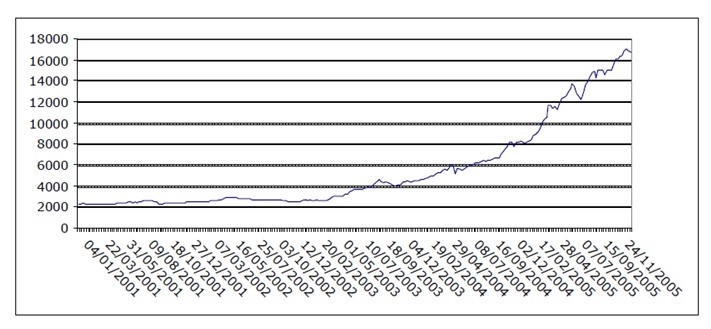
The above performance was attributed to a surging economy, initial public offerings, new listings and a rapid developing capital market (Hakin, 2007).At the height of this rise, the P/E ration was at a worrisome 68, much higher compared to other gulf nations at the time. However, since then, the market has been on a decline. During this high season, a number of IPO were issued, most of them oversubscribed some10 or 12 times (Hakin 2007).Between 2003 and 2006 market capitalization grew by 108 percent and the volume of share traded by 988 percemt (Onour 2009, p.16). Onour (2009) has pointed out this scenario is typical of a highly concentrated market with few companies accounting for much of the market capitalization
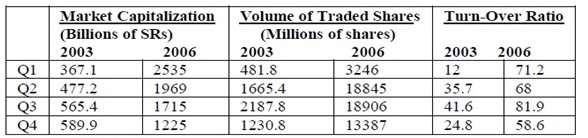
Table 2. Market growth indicators (2003-2006)
Initial Public Offerings
High share trading leading up to early 2006 was primarily due to huge influx of first-time investors attracted by under-priced IPOs (Al Twaijry 2006, p8). This rush would see the index and market capitalization making astronomical gains of 700 percent and $ 800 billion respectively for the period between 2003 and February 2006.
Alanazi, Liu & Foster (2010) has likened this pattern to the “clustering period” common to nascent stock markets that is characterized by increased number of private firms going public (63).
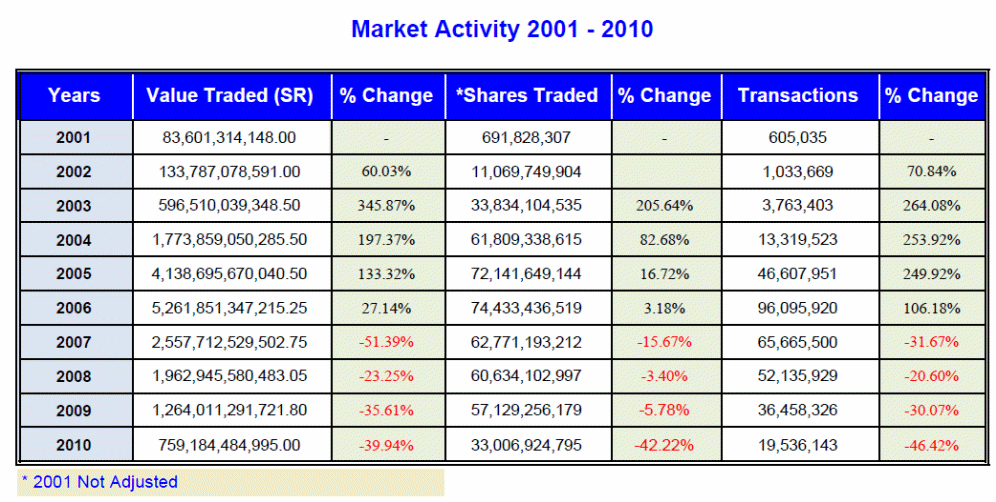
Table 3. Market activity 2001-2011
Value traded, Shares traded and Transactions
The first half of the decade was marked with marked growth in activity at the bourse. The number of transactions and value of traded volume tripled between 2002 and 2005 but slowed down in 2006.The value of shared traded rose from SR 83.6 million in 2002 to SR 4.1 trillion in 2005 representing a staggering 4850 % rise. This meteoric rise would not last and it declined by over 80% in 2006. As individual stocks reached their highest price peaks, speculation and much media publicity lead the decline in trading, resulting in significant reduction in share volumes and triggering further market declines (Hakin 2007). By the end of the first quarter of 2006, the value of shares traded fell by 26.2 percent (from 1,805,729 to 1,332,752 million riyals) compared to a rise of 21.7 percent in the preceding quarter (Hakin 2007).
This trend would continue for the rest of the decade. The number of shares traded rose from 691 million in 2001 to 74.4 billion in 2006 representing a shocking 10 650% rise. This period would also see the prices of the shares double many times over. The rest of the decade would experience a steady drop to close at 33 billion share trade in 2010. This represents
a drop of 56 percent from the mid decade peak. A similar trend in observed in the number of transaction. Beginning 2001 to 2006, the total transactions rose by 160 %. Between this peak of 96 million it dropped to a low of 19 million transactions at the close of the decade representing a 150 % drop.
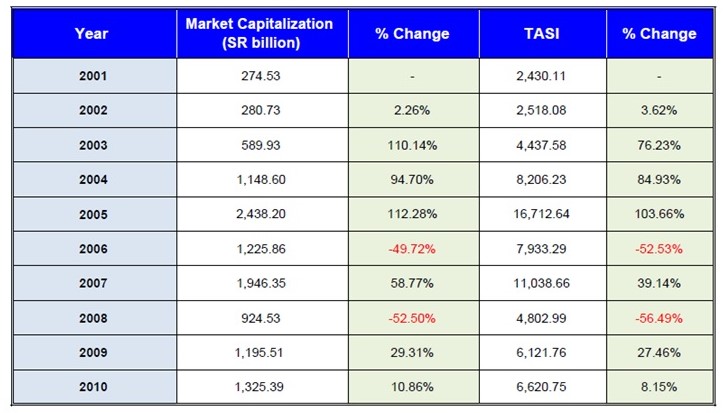
Table 4. Market Capitalization & Tawadul All Share Index (TASI) 2001/2010
Market capitalization
Beginning 2001, market capitalization rose from SR 274 billion in 2001 to SR 2.4 Trillion in 2005. This represents a rise of about 790 percent. The peak of market capitalization was recorded in 2005. The 2006 crash saw a sharp decline of 50 % from this peak being realized.
The decline in market capitalization would continue down SR 924 billion, the lowest for the second half of the decade. The market would undergo slight consecutive improvements in 2009 and 2010 to register a 43% rise from the 2008 low
Table 5. Tawadul All Share Index (TASI) between 2006 and 2007
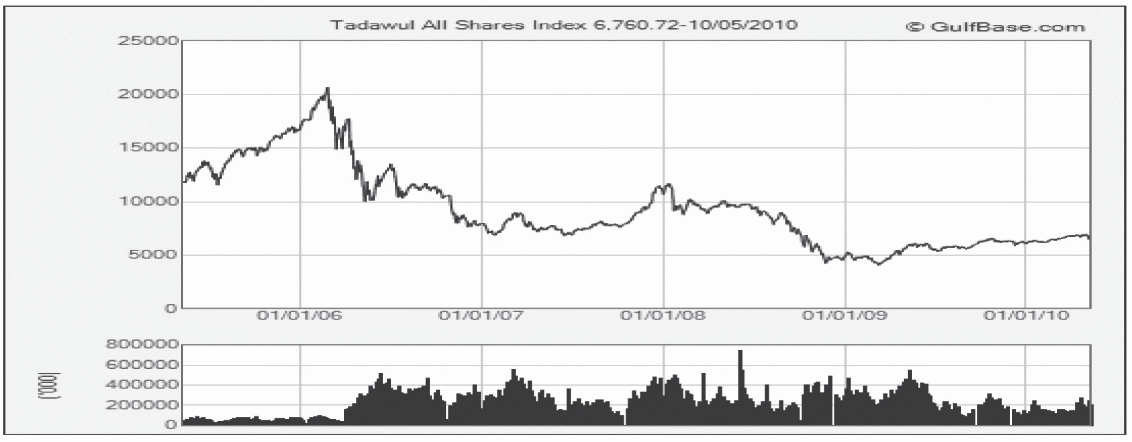
TASI was fairly stable between 2000 and 2002. A sharp rise in the index between 2003 and 2005 saw the value of the index touching a high of about 17000 representing a 280 rise over the same period. This season marked the highest volatility ever witnessed in the whole of the decade.By the end of 2006 the index had lost almost half of its points the previous year.
The index would improve by about 40 % in 2007 to be followed by over 50 % dipped in 2008. In the last quarter of the century the index gained slightly to close at around 6600 points.
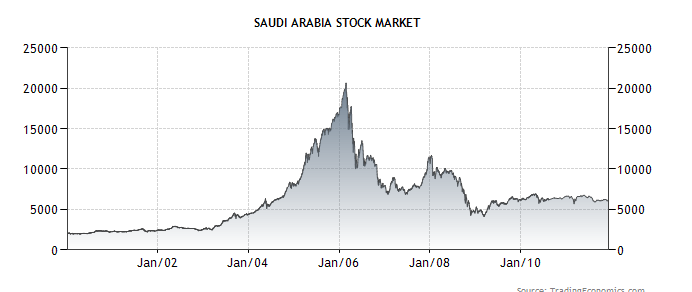
SASEIDX
The following is graph of SASEIDX, an index that tracks the performance of large companies listed in the Saudi Stock exchange. Since 20014 to 2011, SASEIDX has averaged 4560.37 points.
The Index reveals that the collapse of the stock market that began in March 2006 continued for the rest of 2006 and into the first half of 2007. However the index managed to stabilize at the end of 2007, hovering between 7,000 and 12,000 (Hakin 2007). Share Prices of small companies continued to experienced wild volatility, and weak investor sentiment saw the index register new 12-month lows and sunk lower (Hakin 2007).Towards the end of the first half of 2007, the index had fallen by 64 percent from the high of 20,634 attained on February 20, 2006 (Hakin 2007).
CMA introduced a number of measures to raises liquidity level this included raising the daily price change limit from 5 percent to 10 percent and opening the market for direct investment in individual companies to foreigners in Saudi Arabia (Hakin 2007). Authorities also implemented measures to limit amounts on personal credit. This was out of the realization that high liquidity in the economy had greatly contributed to the unprecendented development in stock exchange and that banks loan initially borrowed for other purposes had been diverted to the stock market (SAMBA, p.8). However, this measure did not halt the depreciating market and the market index after hitting a low of 6947 at the end of January 2007, continued to languish for the rest of that year.
For the whole of 2007, the the TASI lagged global benchmarks 9 (SAMBA, p.9) while for the better part of 2008, the deviation from global benchmarks was not significant. (The Saudi Stock Market: Structural issues, Recent Performance and Outlook SAMBA 2009, p.9).2008 proved another tumultuous year as despite a promising first quarter buoyed by surging global markets and oil prices, TASI still shed 49 percent ending at 4800 in December.
In the first quarter of 2009, TASI closely rallied emerging markets (based on MSCI EM) however ,afterward the performance was constrained by global economic recession and plummeting on oil prices(SAMBA 2009,p.9).In the second quarter the market stirred up due to signs of global economic recovery. Oil prices also started to go up.However; debt problems in the Saudi corporate sector that came to the fore from May later stalled TASI. In the wake of global financial crisis local bank cut credit thus deterring investment and negatively impacting on the non-oil sectors (Key financial sectors 2010 SAMBA, p.3).
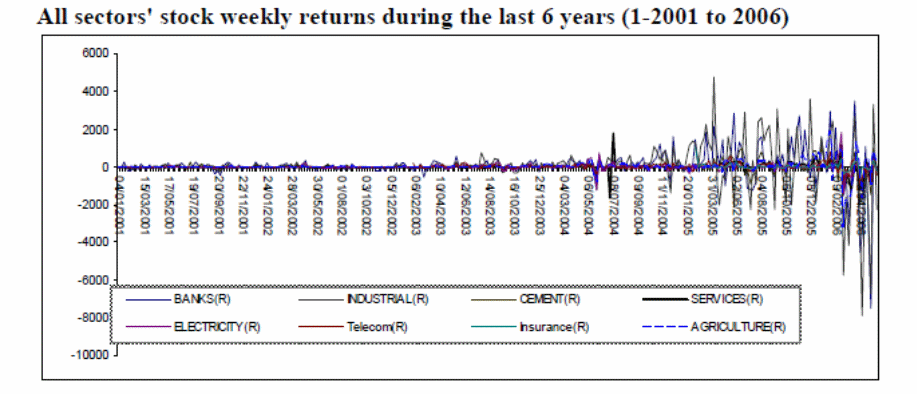
The above graph illustrates the trend of weekly stocks returns of the main stocks at that time in relation to volatility between 2001-2006. It is clear the returns of the stocks remained fairly stable between 2001 and 2003. It also reveals that volatility was particularly high between 2004 and the end of 2005. In 2006 the volatility shifted to below zero. This trend was observed in all the sectors.
Individual market
The Saudi Stock exchange was initially composed of 6 main sectors during its inception in 1985 namely: banking industry, cement, services, electricity and agriculture (Al-Twaijry 2006 p.12). Each of these was indexed with 1000 points base (Al-Twaijry 2006, p. 12). By the end of 2003, telecom was added and insurance index in March 2005.sectors had been added. As of December 2011, The current ones are: Banking & financial services, petrochemical industries, cement retail, energy and utilities, agriculture & food industries, telecom & information technology, Insurance, multi-investment, industrial investment, building & construction, real estate development, transport, media & publishing and hotel and tourism. The performance of each of these sectors is evaluated in the following section. High risk stock and recommended stocks are based on the history of EPS and P/E ration tracked between 2002 and 2010 using annual review data provided by Saudi Arabia stock exchange with a bias for a growth investor. A history low mean of E/P (below 15) and a high EPS (3 and above) forms the basis for a good stock to purchase and vice-versa.
Table 6. Sectoral Indices
Banking sector
From 2001-2006, the number of transaction, volume and value of traded volume increased moderately. However the industry suffered a decline in 2007 attributed to the 2006 crush and global economic meltdown that began to be felt. The sector continued with the poor trend for the rest of the decade. As can be observed from table 6, the sector experienced a sharp decline in 2008 during which time it lost over 50% of its previous year’s index point.However it stabilized and made a slight gain in 2010. Over the decade, few banks joined the sector. From the initial 9 listed in 2002, only 2 additional ones joined the industry by September 2010. However the sector remains a dominant player, accounting for 24.90% of the market capitalization in 2010.Basing on favourable history EPS and P/E ratio, the recommended stocks are RIYAD, SABB and SAMBA. The high risk ones are Alinma and Aljazira
Cement sector
This sector witnessed slight growth in the first quarter of the decade. Its best year of performance was 2006.However, the sector experienced a steady decline between 2007 and 2008 before stirring up in 2010.Sectoral indices in table 6. shows the sector improved by about 50% between 2008 and2010 despite a sharp decline record in 2008 compared to the previous year. The sector is poised for further improvement given massive infrastructure projects by the government totaling about $500 billion about to take off. This favourable climate saw the Tawadul all share cement index climb 20% in the first one month of 2011 in addition to a dividend of 66% offered by cement companies (Haroutunian & Hankir ,2011). Despite restriction on export cement companies posted moderate profits in the first quarter of 2011. Southern Province cement Co, Arabian Cement, Yamamah Saudi Cement, Qassim Cement and Yanbu Cement all reported quarterly profits in excess of 33 %. However, new listed Jouf cement is considered a high risk stock
Service sector
For the much of the first half of the last decade the service industry registered high growth emerging the overall best performer for a number of years. The sector however reported a significant dip of around 45 % in the value of traded shares in 2007 compared to the previous year. Because this sector was split in 2007 into different categories, its analysis has been focused to the subcategories that were created under it.
Telecom and Information technology
From 2003, when it was first inaugurated, this sector registered growth between 2003 and 2006 as the value of traded shares increased by an impressive 90 %. However, it decreased by over 75% between 2008 and 2010. The value of traded shares sharply declined by 80% in 2007 compared to the previous year. The number of listed firms is still low as only 5 were listed by the end of September 2011.Good stocks are those of STC and Etihad Etisalat. Atheed Telecom stock is not recommended.
Insurance
This sector enjoyed high growth between 2006 and 2009 before declining by a high of 50 % in 2010. The volume and value of shares traded climbed steeply in 2007 and steadily in 2008 and 2009. Fear of further global recession could have spurred investors to take more insurance cover for their assets. This sector also recorded the highest increase in the number of listed firms. From a single insurance firm in 2006, the number jumped to 31 by the end of September 2011.However many of the firms made heavy losses in the first three quarters of 2011 and caution should be exercised in buying in this sector. Still, the high risk ones are Saudi Re and AICC.
Petrochemical industry
This category was first created in 2008. Market data from Tawadul indicates that the sector underperformed between 2008 and 2010. The transaction, volume and value of trading declined steadily from 2008 to 2010. As table 6.shows this sector lost over 60 % of its 2007 overall index points but made a slight improvement in 2010.According to a report by SAMBA, the decline was due to a collapse in global demand for industrial chemical and a shortage of feedstock. Considering the massive oil reserve of Saudi Arabia and government subsidy on some feedstock, the firm foresees recovery for the sector in the near future. This sector is the most dominant, accounting for over 38 % of the market shares as of December 2010. Petrochemical was the biggest looser of 2008,shaving off 63 of its market value attributed to the global supply glut and seemingly inadequate gas feedstock at home (SAMBA,p.9).In 2010, the petrochemical industry stabilized. In it outlook of key financial sectors, Financial group, SAMBA predicts growth for the petrochemical industry as global industrial investment and production. Recommended stocks are SABIC and SAFCO. High risk ones are CHEMANOL, Petro Rabigh and Petrochem.
Retail industry
Based on volume and value of trade, this sector experienced a moderate from 2008 up to 2009 before recording a slight decline in 2010.Sectoral indices show the sector suffered a large decline of about 70% compared to 2007. It however recovered minimally in 2009 before again recording a marginal drop in 2010. Recommended stocks are Janir and Alhokair while high risk ones are SASCO and Thimar.
Energy & Utilities
This sector declined in 2009 before making a slight gain in 2010.Data also shows this sector lost many of its listed firms as from the 6 listed in 2002, only two were still in the bourse by September 2011. Recommended stocks are Gas & Industrialization and Saudi electricity.
Agriculture & food industries
This sector has been on a steady decline since 2008. The number of transaction, shares traded and value of traded volume have all been on a steady decline. Many agricultural firms have recorded losses since 2008 and thus investor should be cautious before acquiring stocks in this sector. The high risk ones are Food and Anaan Holdings. A performer is Almarai
Multi-investment sector
This sector has been on a steady decline in transactions, volume and value of traded volume since 2008. A 50 % decline in value of traded shares occurred between 2009 and 2010.Records show it is not a profitable sector. High risk stocks are those of Saudi Advanced, Kingdom and Al Baha.
Industrial investment
This sector was on a steady decline between 2008-2010 in terms of transaction, shares traded and value of the traded shares. High risk stocks include MA’DEN and Maadaniyah.
Building & construction
Saudi Stock Exchange data shows the sector experienced a steady decline since 2008 when the sector was created. The data also shows reduced activity as the value of shared sharply declined between 2008 and 2010. Many of the firms listed incurred losses. Some good stocks worth considering are SVP, Zamal ASLAK, ALKHODARI and Ceramic.
Real estate development
According to data on shares traded, transactions and value of traded shares, the sector experienced activity between 2008 and 2010. This sector is not profitable going by the 2008-2010 reports from Saudi Stock exchange. Some of the performing stocks are Dar Al Arkam. Poor ones include Taiba.
Transport
Overall, data on activity in transport industry sector show the sector has been on a sharp decline between 2008 and 2010. The value of traded shares declined from SAR 74 billion to a low of SAR 8 billion in the same period while the number of shares traded declined by 75% during the same period. This has been attributed to bank refusal to advance loans to the industry.
Media & Publishers
In spite of being a young and small market this sector experienced sharp decline between 2009-2010. The value of shares traded declined by 80% between 2008 and 2010 while volume of share traded declined by 70 % over the same period. This sector is not profitable. A high risk stock is that of Tihama.
Hotel & Tourism
Data shows this sector recorded dismal performance between 2008 and 2010.
The value of shares trade decreased by over 60% while the number of shares traded declined by the same percentage despite a slight rise in 2009.This sector is not profitable and is not recommended. A high risk stock in this sector will be that for Shams.
Conclusion
Since its inception in 1984, the Saudi Stock Exchange has undergone restructuring to promote fairness and enforce compliance with regulatory laws. From the beginning of 2001, when it was launched, Tawadul has undergone tremendous growth. The number of listed firms has more than tripled and the market capitalization has multiplies many times over.
Large scale IPO issued in the beginning of the decade attracted a lot of Saudi buyers who possessed little skills in investment. At the same time a lot of people got to know about the stock exchange as a means of investment. What followed was a huge demand for shares which resulted in skyrocketing of prices. The culmination of this rise was the attainment of the highest TASI that was over 20,000 points and which was maintained for a number of days. As expected the prices boom soon crumbled resulting in severe economic losses.
From the second quarter of 2006, activity in the market declined resulting in panic which forced the market regulators to act to arrest the situation. In 2008 worsening global financial crisis and drop in oil prices, resulted in a decline in all the sectors of the bourse.
Top performing companies maintained EPS and EP /S ratio within preferred limits throughout the 10 year period. However, the market continues to be dominated by Petrochemical and financial services industries. The government should be commended for allowing foreigners to trade in the market. However current restrictions should be lifted in order to attract more foreign institutions. The market would benefit as this would lead to greater scrutiny of activities at the bourse and less speculation.
References
Al-Twaijry, A. (2006) Saudi Stock Market Historical View and Crisis Effect: Graphical and Statistical Analysis. Web.
Alanazi, A., Liu, B., & Foster, J. (2010). Saudi Arabian IPOs Productivity and Efficiency. Middle Eastern Finance and Economics, 6. 63-70. Web.
Euromoney. (2003).Saudi Equity Market, Web.
Haroutunian, M., & Hankir (2011) Saudi King’s building spree helps cement producers beat Tadawul Benchmark. Bloomberg. Web.
Hakin, S.R. (2007) Gulf Cooperation Council Stock Market Since September 11. Web.
Onour, I.A. (2009).Testing Efficiency Performance of Saudi Stock Market. Journal of Economics & Administration, 23(2), 15-27
SAMBA. (2009). The Saudi Stock Market: Structural Issues, Recent Performance and Outlook. Web.
Saudi Stock Exchange (Tadawul). (2011).Annual Statistical Report-2010. Web.
Saudi Stock Exchange (Tadawul). (2010).Annual Statistical Report-2009. Web.
Saudi Stock Exchange (Tadawul). (2009).Annual Statistical Report-2008. Web.
Trading economics inc. (2011). Saudi Arabia Stock Market. Web.
Ulussever, T., Yumusak, I.G., & Kar, M. (2011). The Day-of-the-Week Effect in the Saudi Stock Exchange: A Non-Linear Garch Analysis. Journal of Economic and Social Studies, 1(1), 9-23. Web.
