Investment Philosophy and Market View
Investment philosophy
Investment philosophy can be defined as those strategies or principles that guide an investor in his investment decisions such as value, technical, growth and the fundamentals (Shleifer 2000). In this case, the portfolio is strictly focused on small carefully selected assets, after carrying out a rigorous due diligence exercise on the underlying economic and financial strength of an individual company that I consider to place my investment. Diversification is by asset class and industry to mitigate the increased volatility and to achieve the most superior returns that outperform the benchmark while at the same time employing average market risks. However, the market is considered to be rational and efficient in determining the asset prices and the individual equities are regarded as correctly priced, based on known financial data derived from the FTSE100 share index. The market has a free flow of information that basically influences the movement of share prices and also has numerous rational investors armed with adequate information avidly following the movement of each individual stock.
Market view
To maximize the asset returns, I would consider acquiring the asset when the market is bearish. At this time, the stock prices are at their lowest levels and some of the investors turn out to be too emotional tend to dispose of their investments as they get scared of losing their money (Fama & French 1993). So, in order to maximize returns, the investor should take advantage of the bearish market and purchase shares when they are at their low levels with the intention of disposing of them off when the market becomes bullish and the prices are at their high level (Fama & French 1996).
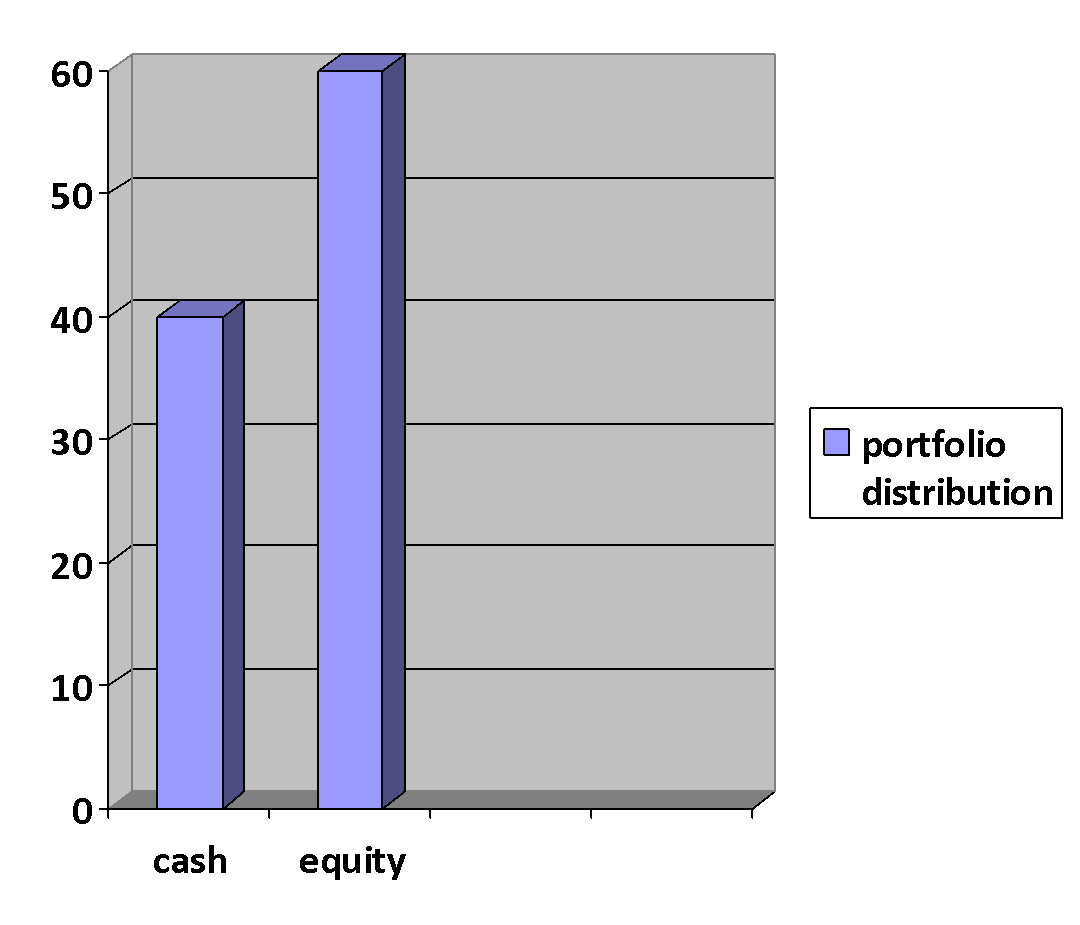
As a moderate investor, the portfolio is spread almost equally between the cash and equity investment. Cash is generally considered to be less risky, and for that matter, it is allocated 40% of the total available funds whereas equity as the riskiest investment is allocated 60% (Sharpe 1964). For cash, investors tend to hedge against any possible risk as they negotiate a pre-determined rate prior to the closure of an investment agreement. Therefore, the future returns are very certain, unlike equity which upon purchasing, the investor has no control over the prices and instead relies on the market trends (Diaz 1990). Despite carrying out thorough historical research before deciding on which equities to invest in, the investors may still find their prices dipping in the long run. As such, they end up selling them at a lower price if not the same price that they were purchased. So, to mitigate such a risk, Pickford (2002) suggested that the investors should expand their investment basket by investing in both cash and equities. Being an efficient market, the assumptions considered in market forecasting are that all the market participants are rational investors, absence of taxes and equal access to information (Dremen & Lufkin 2000).

Portfolio rebalancing strategies
The Constant-mix strategy
According to Case & Shiller (1989), applying the buy and hold strategy, the investors purchase the stocks and then do nothing about them. However, for this particular case, the investor considers a 60/40 ratio between equity and risk-free cash asset with an idea of higher/ lower returns from the stocks if the stock market rises while at the same time using the risk-free cash asset as a floor value. This allocation is positively related to market performance as risky assets are allocated higher proportionate that is commensurate with the expected return but at the same time mitigating the risk which could otherwise result when the market performs poorly by use of risk-free cash assets (Campbell & Shiller 1988). Nonetheless, the buy-and-hold strategy is highly applicable if the asset allocated higher weights perform excellently compared to those with lower weights.
However, to achieve assets rebalancing, allocation is achieved by engaging in trading as the market mechanisms cause changes to the initial ideal balance (Barberis, Schleifer & Vishny 1998). Notably, the application of this strategy ensures that the investor’s risk characteristics remain constant over time and consistent with the risk tolerance level of an investor. By applying this strategy, the investor will consider trading in the best-performing assets and in turn utilize the proceeds in purchasing the worst-performing assets with the expectation that they will perform better in the long run and as such result in maximum returns (Brown 1992). Thus, when the market forces result in changes in market trends, this strategy becomes suitable for rebalancing rather than a buy-and-hold strategy that maintains the investor risk tolerance level.
Investment portfolio theories
Campbell (2000) suggests that investment theories act as a guide to financial planners and investors on the allocation of funds available for investment in a given investment basket. Further Campbell & Cochrane (1999) observed that an investment portfolio is based on long-term goals and is susceptible to market fluctuations and as such the financial planners should always carefully estimate the potential risk associated with each individual investment.
Active portfolio theory
This theory is classified into either patient, aggressive or conservative. Patient portfolios invest in well-established firms that pay dividends regardless of the market performance and thus promise guaranteed revenue. On the other hand, conservative portfolios tend to balance between the riskier and less risky portfolios with the aim of mitigating risk that may result in a riskier portfolio (Gallimore 1994). Finally, the theory further says that aggressive portfolios focus on the highly risky assets that have high returns. So, for this case, the investor is guided by the conservative theory where he considers a 60/40 ratio between the riskier and less risky portfolios.
Modern Portfolio Theory (MPT)
This theory encourages financial assets diversification to hedge against potential business risk and other common market risks. It assumes that all the investors are risk-averse and therefore require them to diversify their investments baskets in such a way that poor performance from one of the financial assets does not result in total loss in the overall investment. For this investment, the investor tries to diversify by holding both riskier assets (equities) and less risky assets (cash) to hedge against future potential risks. The concept of this theory is well applied in this portfolio investment as the investor diversifies his investments to minimize the effects on the desired returns upon happening of risks.
Capital Asset Pricing Model (CAPM)
CAPM deals with the idea of systematic and unsystematic market risks. Unsystematic risks are caused by factors specific to the business, for instance, a change in the product line or the senior management (Sharpe 1964). CAPM measures the risk associated with the asset in relation to market risk. This risk is expressed as a beta (β) which is a correlation to the market average. Assets with β<1 show an average movement in asset return in the overall market whereas β>1 portray a return greater than the overall market.
The Dividend Discount Model (DDM)
DDM is a tool used in the evaluation of stocks using the net present value of future cash inflows. Basically, this model works through analysis and also assumptions related to growth in dividends. Additionally, it is based on speculation and it’s even more popular due to its ability to compare specific numbers derived from the given data with utmost accuracy. This model postulates that security that bears a higher risk must in turn pay more returns for it to attract more investors (Celati 2004). Therefore, as an investor, this is taken into consideration by having an investment basket comprising both equity and cash asset. When an investor buys equities, he expects cash flows during the period. The rationale of this model is explained well by the present value rule which states that the value of any asset is determined by the expected future cash flows which are discounted at a rate that takes into consideration the riskiness of the cash flows. DDM helps the investor to determine future equity growth. This is arrived at by discounting future growth in dividend payments to find out whether the stocks are either overvalued or undervalued. Thus, DDM is instrumental when making an equity purchasing decision as an investor should buy stocks when they are undervalued in order to realize gains in the future. In addition, DDM helps an investor to identify growth in stocks and also to determine if stocks are profitable.
Fundamental and technical analysis
These two methods are commonly used to make trade decisions in money markets. The fundamental analysis enables traders to understand currency characteristics. This is achieved through analyzing fundamentals such as trade balance, monitory policies and interest rates thus allowing the trader to forecast future price movement in order to engage in profitable trades (Ross 1976). On the other hand, technical analysis helps the trader to analyze the past price of a currency. Through this, the trader is better placed to forecast future currency prices. However, Celati (2004) observes that the major problem underlying currency fundamental analysis is the interpretation of conflicting information. For instance, strong GDP information could suggest favorable financial conditions or even make the currency value go up thus giving a wrong signal to investors who may invest in riskier currencies relative to the currency under question. Therefore, fundamental analysis is mostly used as a predictive tool.
On the other hand, Clayton (1998) suggests that technical analysis heavily relies on the price charts to give a clear understanding of the direction that a currency price takes. Therefore, by analyzing the price trend of a currency, a currency trader may well understand the direction that a given currency takes. However, technical analysis alone may not be predictive in that, when a currency stalls, it may not mean that it will not make a move later on. Therefore, to make a rational investment decision, an investor will use the fundamental analysis to forecast the currency movement and at the same time rely on technical analysis to establish the most favorable purchase and disposal price that will yield the highest gains.
Relative versus absolute measures
An investment may possess absolute performance persistence if it outdoes the set benchmark several times (Campbell 2000). However, this measure has an impact on the speed at which the information causes an impact on the security prices. More so, it has a far-reaching effect on the portfolio as compared to the market index. Investors who plan to realize their investment objectives in absolute terms construct a portfolio with the greatest probability of attaining intended absolute return with the minimum possible risk (Nofsinger 2002). In selecting stocks, the investment manager should focus on two absolutes that are extremely crucial to guarantee excellent performance. These absolutes are dividends and earnings growth. The dividend forms a significant percentage of the total return whereas absolute earning growth is what really attracts the investors to consider purchasing a stock. Therefore, the growth element of a portfolio is a more appropriate indicator of accruing value other than a periodical change in share prices (Kahneman & Tversky 1979).
On the other hand, relative performance persistence is achieved when the portfolio performance consistently outperforms the set benchmarks. Relative persistence has an effect on the choices between the assets to invest in. Relative performance is a good performance measure to make a comparison in a market that contains some other similar investments (Beinhocker 2006). However, this performance measure is based on four assumptions which include; considering the market as the baseline measure, believing that what it gives is the actual performance, belief that relative performance leads to better investment decisions and finally, considering arriving at mixed outcomes for instance situations where the investment managers anticipate the company fundamentals let’s say three to five years into the future but the performance measure reduces this to quarterly or yearly basis as they try to outperform the index.
Evaluation of risk-taking decisions on equity portfolio
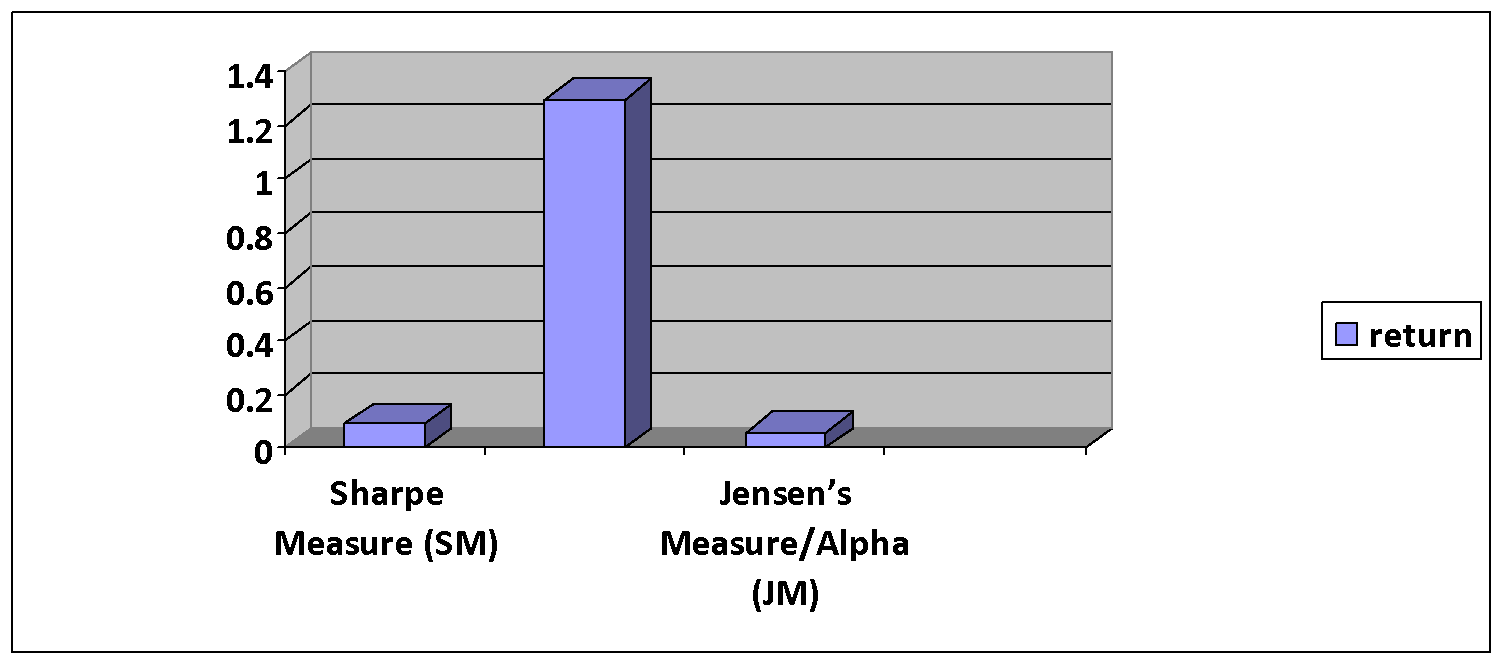
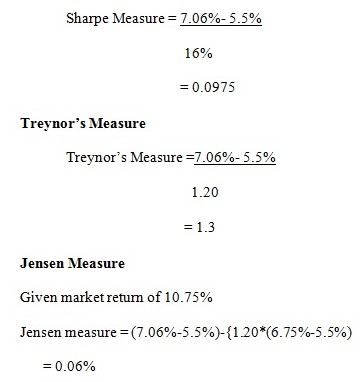
With a Risk-free rate is 5.5% and a Standard deviation of 16% then the performance can be adjusted for risk as follows using the 3 measures of risk adjustment:
Sharpe Measure (SM)
SM = Rp- Rf
_____
Ơp
Where:
- Rp- Total portfolio return
- Rf – Risk-free rate
- Ơp – Portfolio standard deviation of return
The higher the ratio, the higher the risk premium earned per unit of risk showing that the portfolio exhibits superior performance
Treynor’s Measure (TM)
Given a beta (βp) – 1.20
TM= Rp-Rf
_____
βp
Where:
- Rp- Total portfolio returns
- Rf – Risk-free rate
- Βp – Portfolio Beta
The premium earned for non-diversifiable risk exceeds that of the market thus portraying better performance as shown by a higher ratio.
Jensen’s Measure/Alpha (JM)
Jensen’s measure makes use of portfolio beta and CAPM to compute the excess return which can be either zero, negative or positive.
JM= (Rp-Rf) – {βp*(Rm-Rf)}
Where:
- Rp- Total portfolio returns
- Rf- Risk-free rate
- Βp – Portfolio beta/ Measure of risk
- Rm- Market return
- Rf- Risk-free rate
The portfolio has earned a return of 0.06% points in excess of its required return. This value is a good indicator of better performance.

Different investor’s risk attitudes
Different investors possess different attitudes towards risk-return tradeoff. According to Redhead (2003), investors are risk-averse as they tend to avoid risks by giving preference to securities with a high degree of returns, certainty and are reasonably affordable. These types of investors are much more willing to pay extra cash to obtain much more information regarding security to be assured that they are free from any form of unpleasant risk (Barber & Odean 1999). For this case, the investor considers investing in equity despite the risk of losing everything in an attempt of seeking the highest possible returns.
On the other hand, a risk seeker is an investor with an intention of maximizing value by investing in the most promising portfolio regardless of the potential risks (Levy & Post 2005). Finally, a risk-neutral investor is an investor whose risk preference lies between the two fore mentioned extremes. Risk neutrals will not incur extra amounts to have risk transferred to a third party nor will they commit their money in risky endeavors. This class of investors invests in many unrelated assets such that the negative effect of one asset is neutralized by the best performing.
Behavioral investment theory
Behavioral paradigm has risen to tackle difficulties faced by the traditional paradigm and as such, it argues that investment choices can be based on full rationality (Gitman & Joehnk 2000). However, behavioral finance argues that there are limits to arbitrage that cause investor irrationality to be substantial and cause long-term effects on asset prices. To elaborate on investor irrationality in the decision-making process, behavioral finance draws from experimental evidence of cognitive psychology and the biases that arise when people form preferences, beliefs and the way they make their decisions given their preferences and beliefs (Barber & Odean 1999).
Traditional investment theorists trust that any error in pricing caused by irrational traders in the capital market will bring about the opportunity on which rational investors will quickly capitalize thereby correcting the mispricing (De Long et al. 1990). In order to understand the various investors’ behaviors, behavioral economists draw prospect behavioral theory which tries to explain the apparent regularity in most human behaviors when evaluating risks under uncertainty. This theory was developed by Tversky and Kanheman (1974) in their attempt to show how investors manage risks and uncertainties in their investments. The duo observed that investors relied on portfolios whose future outcome was somehow certain unlike those considered to be more probable. Further, they observed that people’s choice was highly affected by the ‘framing effect’. Framing refers to how a problem is viewed by an investor and his mental perception of such a problem. According to Markowitz (1952), people may consider different choices in situations that have similar financial outcomes.
Rational decision theory states that decision-makers spawn a variety of strategies and pursue particular logical actions to resolve problems in regard to the nature of problem decision context and timing (Breitkreuz 2009). As such, rational decision-making involves the choice of the optimum decision and can be achieved by categorizing decision making into three types depending on the level of reasonableness. Gianakis (2004) describes the first category as the most reasonable type which is pure rationality and enhances achievement of the optimum status of the decision making which attains the highest efficiency out of unlimited resources, time and knowledge. Gianakis (2004) points out that this type presupposes the administration dichotomy whereby the former identifies goals to be achieved by the latter. The second type which is less rational is referred to as the incremental type. Lindblom (2005) maintains that this type has goals that are politically feasible and that decisions are made by comparing several existing options which are instantaneous.
To make a rational decision, the decision-makers base their decisions on systematic and logical procedures. Many scholars have come up with different models that can be used to attain rational decision-making. Mintzberg, et al. (1976) categorized decision making into three elementary stages of the rational decision-making process which includes problem identification (understanding the nature of the problem and finding out more appropriate information), development element which involves looking for necessary information and methods of solving problem, and finally the selection element which involves recognizing a problem and assessing optional solutions which can lead to an optimal decision.
Evaluation of investment strategies
As a risk-neutral investor, I applied a value aging strategy that guarantees maximum care in the evaluation of the market for risks. However, I not only consider the financial asset that has the possibility of giving maximum returns but also take measures by including in the investment basket of less risky investment assets, with the intent of minimizing the investment loss should one asset suffer poor performance (Daniel et al. 1998). As behavioral scientists suggest, most investors tend to be risk-averse and taking this into consideration, I carried out a proper analysis of the market before deciding on the class of equities to purchase. This was done by looking at the historical performance of the desired shares to gain a better understanding and hence forecasting the possible future performance.
However, in the course of carrying out an investment in the money and capital markets, I learned that an investor should be up to date with the market information as it plays a bigger part in determining the equity price movement. Also, in considering investing in the stock market an investor should carry out a thorough study of the companies in which he intends to purchase the stocks by paying much attention to its financials, the management and also its future plans. Further, for an investor to realize his investment goal, he should adopt an investment strategy that is consistent with his risk tolerance attitude failure to which a mismatch could otherwise lead to maximum losses.
References
Barber, B & Odean, T 1999, “The courage of misguided convictions,” Financial Analysts Journal, 13 (2), pp. 95-102.
Barberis, N, Schleifer, A & Vishny, R 1998, “A model of investor sentiment,” Journal of Financial Economics, 49 (14), pp. 307-343.
Beinhocker, E 2006, The Origin of Wealth-Evolution, Complexity and The Radial Remarking Of Economics Boston, Harvard Business School, New York.
Breitkreuz, R 2009, Behavioral accounting vs. Behavioral finance: A comparison of the related research disciplines, GRIN Verlag, Munich.
Brown, G 1992, “Valuation accuracy: developing the economic issues,” Journal of Property Research, 9 (3), pp.199-207.
Campbell, J & Cochrane, J 1999, “By force of habit: a consumption-based explanation of aggregate stock market behavior,” Journal of Political Economy, 107 (12), pp. 205- 251.
Campbell, J & Shiller, R 1988, “Stock prices, earnings and expected dividends,” Journal of Finance, 43 (5), pp. 661-676.
Campbell, J 2000, “Asset pricing at the millennium,” Journal of Finance, 55 (17), pp. 1515- 1567.
Case, K & Shiller, R 1989, “The efficiency of the market for single-family homes,” American Economic Review, 79 (14), pp. 125-37.
Celati, L 2004, The Dark Side of Risk Management: How People Frame Decisions in Financial Markets, FT Prentice Hall, London.
Clayton, J 1998, “Further evidence on real market efficiency,” Journal of Real Estate Research, 15 (9), pp.41-58.
Daniel, K et al. 1998, “Investor psychology and security market under- and overreactions,” Journal of Finance, 53 (16), pp. 1839-1886.
De Long, J et al.1990, “Noise trader risk in financial markets,” Journal of Political Economy, 98 (23), pp.703-738.
Diaz, J 1990, “The process of selecting comparable sales,” Appraisal Journal, 58 (2), p. 533- 540.
Dremen, D & Lufkin, E 2000, “Investor overreaction: evidence that its basis is psychological,” Journal of Psychology and Financial Markets, 1(6), pp. 61-75.
Fama, E & French, K 1996, “Multifactor explanations of asset pricing anomalies,” Journal of Finance, 51(8), pp. 55-84.
Fama, E & French, K 1993, “Common risk factors in the returns on stocks and Bonds, Journal of Financial Economics, 33 (12), pp. 3-56.
Gallimore, P 1994, “Aspects of Information processing and value judgment and choice, Journal of Property Research, 11(6), pp. 97-110.
Gianakis, G A 2004, Decision making and managerial capacity in the public sector, Suffolk University Press, Boston.
Gitman, L & Joehnk, M 2000, Fundamental of Investing, FT Prentice Hall, New York.
Kahneman, D & Tversky, A 1979, “Prospect theory: an analysis of decision under risk, Econometrica, 47(5), pp. 263-291.
Levy, H & Post, T 2005, Investments, FT Prentice Hall, New York
Lindblom, CE 2005, The science of muddling through, Houghton Mifflin Co, Boston.
Markowitz, H 1952, “Portfolio Selection” Journal of Finance, 7 (2), pp. 77-91.
Mintzberg, H, Raisinghani, O & Theoret, 1976, “The structure of unstructured decision processes”, Adm. Sci. Q, 21, pp. 246-275.
Nofsinger, J 2002, The Psychology of Investing, Pearson Prentice Hall, London.
Pickford, J, 2002 Mastering Investment: Your Single-Source Guide To Becoming A Master Of Investment, FT Prentice Hall, New York.
Redhead, K 2003, Introducing Investments, A Personal Finance Approach, FT Prentice Hall, New York.
Ross, S A 1976, “The arbitrage theory of capital asset pricing,” Journal of Economic Theory, 13 (3), pp.341-360.
Sharpe, W 1964, “Capital asset prices: a theory of market equilibrium under conditions of risk,” Journal of Finance, 19 (16), pp. 425-442.
Shleifer, A 2000, Inefficient markets: an introduction to behavioral finance, OUP, Oxford.
Tversky, A & Kahneman, D 1974, “Judgment under uncertainty: heuristics and biases,” Science Journal, 185 (45), pp. 1124-1131.
Appendices
Portfolio performance evaluation
Comparison of the rate of return
HPR Return= 7.06%
FTSE 100 performance rate for same period 6.75%

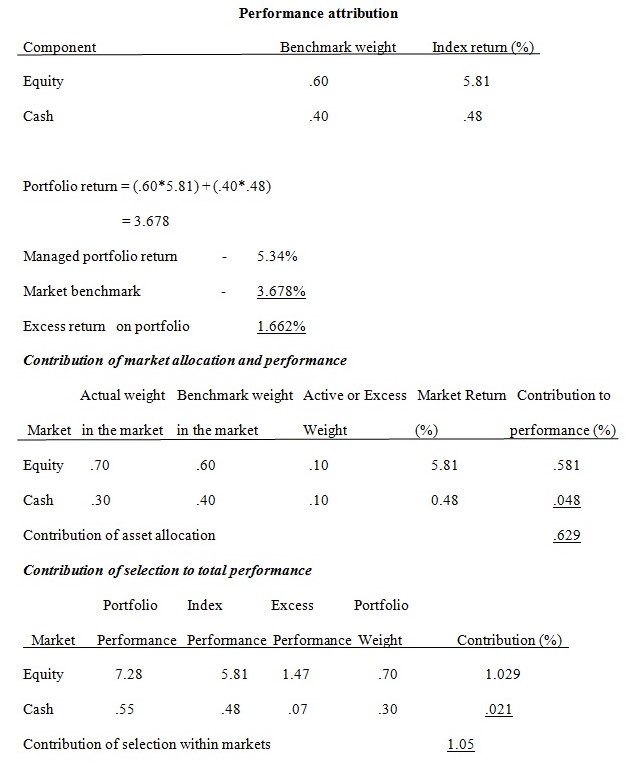
The above analysis so far shows good portfolio performance which is highly attributed to superb asset allocation and selection skills.
Sharpe measure

