Introduction
Capital Asset Pricing Model (CAPM) in finance is normally used to establish a hypothetically suitable return of a security, if that security can be included to a well-diversified portfolio, provided that security is of non-diversifiable risk. CAPM takes into consideration security’s sensitivity to systematic risk or market risk, frequently characterized by beta β, market expected return combined with risk free expected return. The risk faced by the investor for holding the portfolio is the systematic risk (McCracken, 2009). CAPM decomposes the portfolio risk into diversifiable and systematic risk, where diversifiable risk is the risk unique to particular security. It characterizes part of the security’s return that is uncorrelated with the market movement (McCracken, 2009).
According to this model, the investors are compensated by the market for taking non-diversifiable risk other than for taking diversifiable risk. Since diversifiable risks are eliminated through investing in a portfolio, thus each security in a portfolio holds diversifiable risk, but by investing in a portfolio the investor is only exposed to systematic risk (Holton, 1996). Therefore, this paper will evaluate features of CAPM and examines its effectiveness in 21st Century; it will also illustrate how CAPM is applied in determining the expected return of a portfolio.
CAPM development
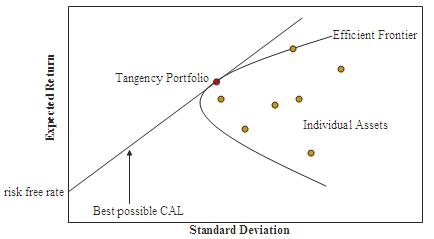
In 1952 Harry Markowitz started the contemporary finance age by demonstrating how diversification lowers the variance and standard deviation of the portfolio. He started his work on the idea that return of the stock is usually distributed evenly and investors like returns and dislike risks. Thus, investors look for a portfolio with low and high standard deviation and mean respectively. Portfolio with superior returns for any given risk level is termed as Mean-Variance Efficient Frontier (MVE). The diagram below shows the Markowitz Efficient Frontier.
CAPM was established by Jack Treynor in 1961 and 1962, William Sharpe in 1964, John Lintner in 1965 and Jan Mossin in 1966 independently, adding to earlier work by Harry Markowitz who introduced diversification as well as Modern Portfolio Theory (McCracken, 2009). As a result of their contribution to financial economic Markowitz, Merton Miller and Sharpe together received Nobel Memorial Prize in Economics. CAPM is a finance model that is well known as it helps explain the world and most investors would like it to be correct, which is not the case (McCracken, 2009).
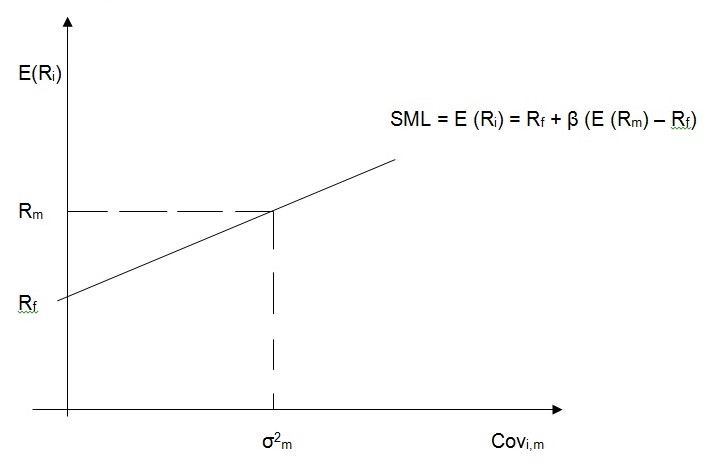
Risk is normally decomposed into diversifiable (unsystematic) risk and non-diversifiable (systematic or market) risk. Those investors that are diversified are more concerned with the market risk measured by beta. Beta is a security’s contribution to risk of completely diversified portfolio and it is determined by regressing security’s return against market portfolio (Globusz.com, 2012). This means that beta of Treasury bill is zero and that of market portfolio is always 1.00. A firm with a beta coefficient of 1.2 can be interpreted to mean that the asset is more risky than the market portfolio implying that if the returns of the market move by 1% relative to the mean then the return of the asset will vary by 1.2% relative to the mean (Globusz.com, 2012).
Beta is calculated using the following formula.
β = Covi,m / δ2m
Where, Covi,m is the covariance of security with the market portfolio δ2m is the variance of the market portfolio (Globusz.com, 2012).
CAPM Assumptions
CAPM is developed based on the following assumptions:
- Transaction costs and taxation do not exist in the capital market therefore there is free flow of funds between assets depending on the yields,
- All investors are Markowitz efficient investors and therefore will invest in a portfolio of risky assets along the Markowitz Efficient Frontier,
- Investors can borrow and lend at the risk-free return rate,
- Investors seek to maximize their single period utility and,
- Inflation is not an important consideration because it does not significantly affect the performance of the portfolio. However, should inflation be an issue it will be effectively managed (Globusz.com, 2012).
Additionally, CAPM presumes that the historical returns standard deviation is an ideal proxy for future risk connected with a particular asset.
CAPM is calculated using the following formula.
E(Ri) = Rf + β(E(Rm) – Rf)
Where;
- E(Ri) is expected return
- Rf is the risk free rate
- β and (E(Rm) – Rf) is the beta and market premium respectively (Globusz.com, 2012).
Under CAPM a portfolio will include both risky and risk-free securities (McCracken, 2009). Therefore, the risk and return of such a portfolio will be measured as follows;
Let Wrf be the investor’s wealth committed in the risk-free security
Thus, the portfolio return is measured as follows;
E(Rp) = WrfRf + (1 – Wrf)Ri
Where, Rf, and Ri is the average return of the risk-free security and risky security respectively (McCracken, 2009).
While portfolio risk is as follows;
E (σp) = √ ((1 – Wrf) 2 x σi2)
Technical problems
CAPM has been criticized to have many problems that include; (1) CAPM presumes that there are no transaction costs or taxation, and thus if costs do not exist investors will sell or buy mispriced assets plotted below or under the SML. (2) market portfolio comprises of all securities in all the markets, where every security is weighted through the use of its own market capitalization. Therefore, this presumes no inclination between securities and markets for single potential and active investors, and that potential and active investors select securities exclusively as their return-risk profile function. It also presumes that all securities are considerably divisible to amount that can be transacted or held (Valuebasedmanagment.net, 2011). (3) CAPM presumes that all potential and active investors will deem all their securities and optimize only one portfolio.
This assumption contradicts portfolios owned by individual investors since people have a tendency of having fragmented portfolios, multiple portfolios, and or for every objective one portfolio. Finally, market portfolio must in theory embrace all forms of securities that can be held by any investor like an investment, including, real estate, art and human capital. In reality, that type of market portfolio cannot be observed and investors normally use a proxy such as stock index to replace the real market portfolio. Unfortunately, this replacement has been indicated to be unsafe and may result to false conclusions to the soundness of CAPM and as a result of lack of any real market portfolio, it is alleged that CAPM may not be tested empirically (Valuebasedmanagment.net, 2011).
CAPM in 21st century
When constructing the portfolio the CAPM calculated return gives us the theoretical value of the security which means that is what the asset is expected to value and therefore that is the value which will plot the security on the Security Market Line (SML) (Levy, 2012). The SML explains the CAPM functions based on Markowitz Portfolio Theory, the risk of the security in a portfolio is the covariance of that security with the market portfolio M. However, the economic realities are that the actual price of the asset in the market is determined by market forces of demand and supply of that asset
which can either properly price the asset and plot the asset on the SML (Asset A), or undervalue the asset and place it above the SML (Asset B) and or overvalue the asset and place it below the SML (Asset C) as shown in the diagram below assuming that the actual returns posted by these assets in the market were 14.8%, 18% and 12% for Asset A, B and C respectively.
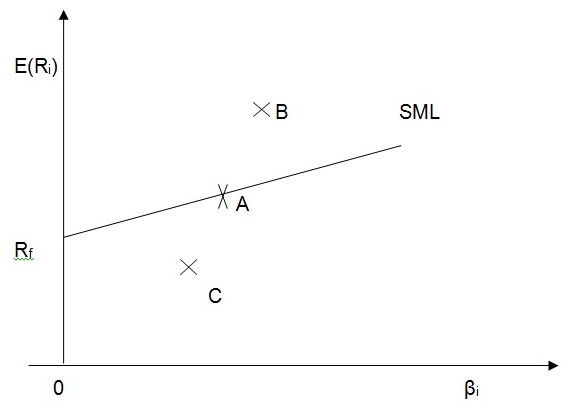
In portfolio construction the best decisions are to buy all the undervalued assets in the markets like Asset B when constructing the portfolio and sell off any overvalued assets like Asset C currently held when managing a portfolio. This way portfolio will be constructed at a discount price while asset should be sold at the market value (Levy, 2012).
CAPM is experimentally rejected, because Expected Utility Theory (EUT) on which it is founded is rejected. Thus, it is baffling why CAPM is broadly employed by professional investors and academics despite its criticisms. The first stage of the CAPM’s empirical tests revealed mixed outcomes: most studies like that of Black, Jensen and Scholes (1972) supported CAPM because the cross-section mean returns and beta were found to have a positive correlation as forecasted by CAPM. But some variables like personal stock’s variance, β2, and skewness makes CAPM to be unfinished which considerably explain cross-section of the mean returns, in opposition to CAPM (Levy, 2012).
Thus, in order for the beta to have better descriptive power of cross-section of the returns, a number of econometric models are employed to take care of any possible measurement errors as well as some errors in variables for example standard error measure.
The second stage of empirical studies reveals some anomalies that persistently emerge when using CAPM to explain cross-section returns. The weightiest anomalies accounted in empirical studies are Small Firm Effect (SFE), Weekend Effect, Value Premium and Momentum Effect (Abbas, 2011). These effects mean that the cross-section returns as shown by beta are not completely explained and that a number of other variables that are not incorporated in CAPM also describe the disparity in the cross-section returns in the market. Because CAPM does not clarify these phenomena, these effects are known as market anomalies. It can be noted that some effects like Monday Effects are nowhere to be found today probably because the public is well aware of them and they are effectively exploited by the professional investors.
The 1992 study by Fama and French presented the most determined empirical CAPM’s criticism. They maintained that beta contains no descriptive power. Therefore, their study constituted a more strict criticism for CAPM than other previous criticism, which showed that cross-section returns and beta are positively as well as considerably associated (Abbas, 2011). Particularly, in several regressions accounted by Fama and French (1992), regression coefficient related to β was irrelevant while other variables not linked to CAPM became significant factors when explaining cross-section of the returns. Thus, Fama and French (1992) proposed Three-Factor Model as a replacement for CAPM. The Three-Factor Model may be justified theoretically by Arbitrage Pricing Theory (APT), but the chosen factors are unmotivated by theory as is the case for beta in CAPM. The factors rather depend on observed empirical association between cross-section returns as well as various variables. Three-Factor Model comprises three descriptive variable: beta, “Small minus Big” (SMB) firms size and “High minus Low” (HML) book-to-market values (Levy, 2012). Therefore, it is important to note down that even Three-Factor Model that shows that the beta is irrelevant does not renounce it. This means that β is believed to be significant explanatory variable, even if it is not the major explanatory variable even with Three-Factor Model that criticizes CAPM (Levy, 2012).
The hypothetical weaknesses of the CAPM are addressed through the use of modified-CAPM. There are various modified versions of CAPM with numerable uses. One of them is the issue of y-intercept or CAPM that does not use risk-free lending or borrowing. Another contention is that β is unstable and sensitive to the economic factor; therefore, Conditional CAPM (CCAPM) or time-varying β that not only embraces time-varying β on a set of information but also describes anomalies is needed. The CAPM failed due to no consideration of the macro-economic variables as asserted by Pettengill, Sundaram and Mathur (1995) as well as Fletcher (2000) when they examined conditional beta-return association. The CCAPM effectively deals with the anomalies in the stock market (Lettau and Ludvigson, 2001: Zhang, 2003: Petkova and Zhang, 2005). Conversely, anomalies like momentum and Book/Market cannot be described by CCAPM; in addition most significantly, the conditional alpha is huge and important which indirectly violates CCAPM (Abbas, 2011).
Conclusion
From its foundation in 1961 by Jack Treynor and others who followed later, there is evidence that CAPM has been in existence for a long period of time. CAPM captured minds of many people as well as investors in financial econometrics field, with approval in its foundations, but soon after the researchers began looking at CAPM sceptically due to anomalies, ineffective market portfolio as well as normality condition. Thus, they began to search for alternatives for it. Despite its criticisms CAPM is still being used today by investors. CAPM can be used in portfolio construction to give the minimum return a security or asset should yield or return in order to justify being included in a portfolio.
Portfolio construction
Supposing an investor is considering evaluating three portfolios made up of companies in FTSE 100 with each portfolio having four companies. The Portfolio A is made up by firms with betas less than one, Portfolio B comprises firms with betas approximately to one and Portfolio C is made up of shares with betas greater than one as shown by Table 1 below.
Table 1: Portfolios
Table 2: Portfolio A
Portfolio A had the highest return of 2.286% for the period 2005/6, followed by Portfolio B with a return of 2.254% while Portfolio C had the least return of 2.071% during the same period. For the year 2007/8 Portfolio A returned the highest return of 0.507% compared to Portfolio B and Portfolio C that earned -0.091% and -1.801% respectively. Similarly, for the period 2009/10 Portfolio A returned the highest monthly return of 3.813% followed by Portfolio C with a monthly return of 3.776% while the investor who held Portfolio C received the least monthly returns.
Table 3: Portfolio B
In general, if an investor held all these portfolios for the entire period from 2005 to 2010, he/she received more return from Portfolio A of 2.154% followed by Portfolio C with portfolio return of 1.139% while portfolio B gave him/her the least returns of 1.13% as shown by Table 2, Table 3 and Table 4.
Table 4: Portfolio C
Using CAPM assuming that the portfolio comprises of assets in each portfolio and UK Treasury bill with a 3 month maturity period and yielding 0.50%.
E(Rp) = WrfRf + (1 – Wrf)Ri
Wrf = 50%
Table 5: CAPM
From the Table 5 above Portfolio A still yields the highest return of 1.33% when evaluated using CAPM, followed by Portfolio C which has a portfolio return of 0.82% while Portfolio B has the least return of 0.815%.
In conclusion, it means that CAPM is still an important measure as it still leads to the same decision as above. Thus, CAPM can be used in portfolio construction to give the minimum return a security or asset should yield or return in order to justify being included in a portfolio.
References
Abbas, Q., Ayub, U., Sargana, S. and Saeed, S. 2011. From regular-Beta CAPM to Downside-Beta CAPM, European Journal of Social Sciences, 21(2): 189- 196.
Globusz.com. 2012. Capital Asset Pricing Model (CAPM. Web.
Holton, G. 1996. Capital Asset Pricing Model. Web.
Lettau, M. and Ludvigson S, 2001. Resurrecting the (C)CAPM: A Cross-Sectional Test When Risk Premia Are Time-Varying, Journal of Political Economy, University of Chicago Press, 109(6): 1238-1287.
Levy, H. 2012. The Capital Asset Pricing Model in the 21st Century: Analytical, empirical and behavioural perspectives. New York: Cambridge University Press.
Markowitz, H., Todd, P. and Sharpe, W., 2000. Mean-variance analysis in portfolio choice and capital markets. New York: John Wiley and Sons.
McCracken, M. 2009. CAPM- The Capital Asset Pricing Model. Web.
Petkova, R. and Zhang, L. 2005. Is value riskier than growth? Journal of Financial Economics, Elsevier, 78(1):187-202.
Pettengill, G., Sundaram, S. & Mathur, L. 1995. The conditional relation between beta and returns, Journal of Financial and Quantitative Analysis, 30: 101-16.
Valuebasedmanagment.net. 2011. Capital Asset Pricing Model CAPM. Web.
Zhang, L. 2003. The value premium, Working paper (University of Rochester, Rochester, NY).
