Introduction
Waterside Medical (WM) is a manufacturer and supplier of fine surgical instruments. The outbreak of Covid-19 has affected the company’s supply chain. The pandemic has led to an increase in sales, and the company has been experiencing stock shortages. This problem has been caused by inventory management reviewed before the pandemic. The current inventory strategy has forced the company to work with what is available (Caro and Sadr, 2019). To resolve this issue, there is a need to review the system using the data collected during the pandemic. Therefore, this analysis aims to provide ABC analysis, inventory weeks, and overall inventory to help analyze the causes of the available problem and offer recommendations to the company.
ABC Analysis
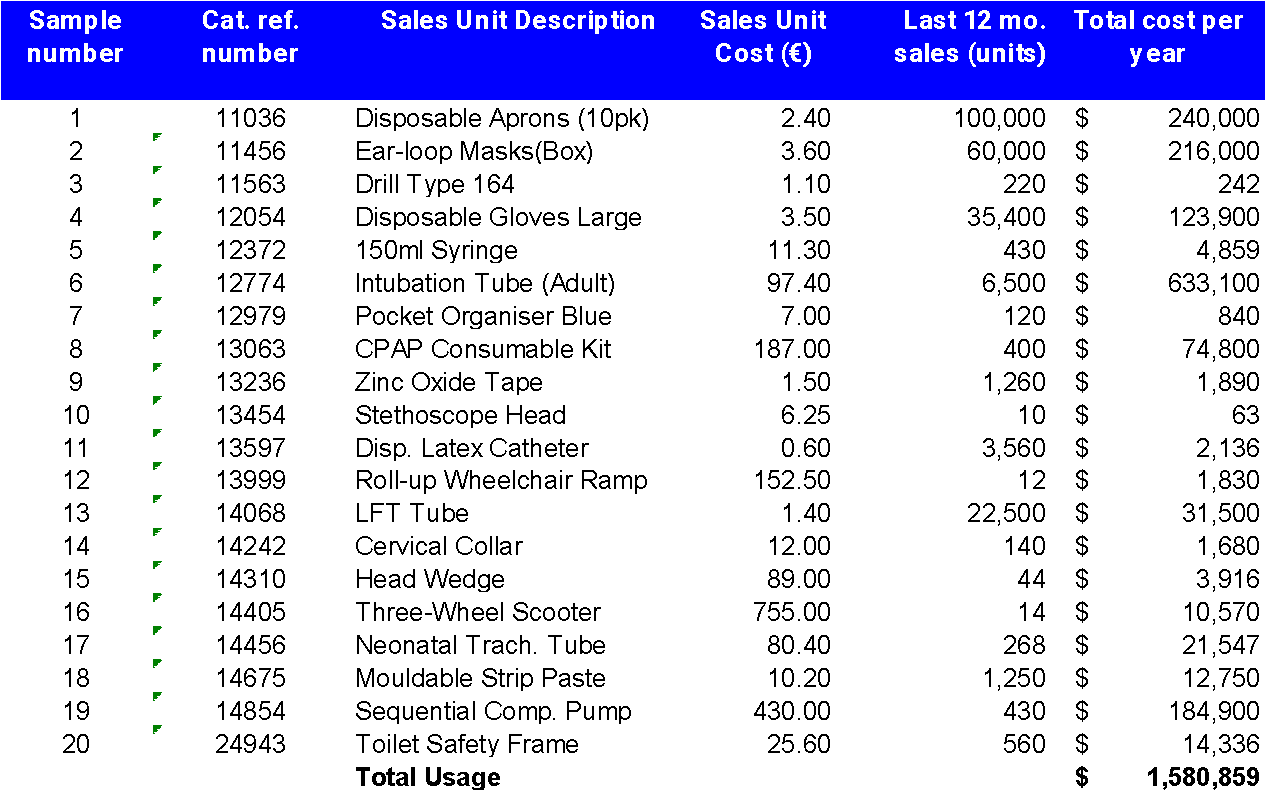
Total cost per year= Unit cost * total cost per year
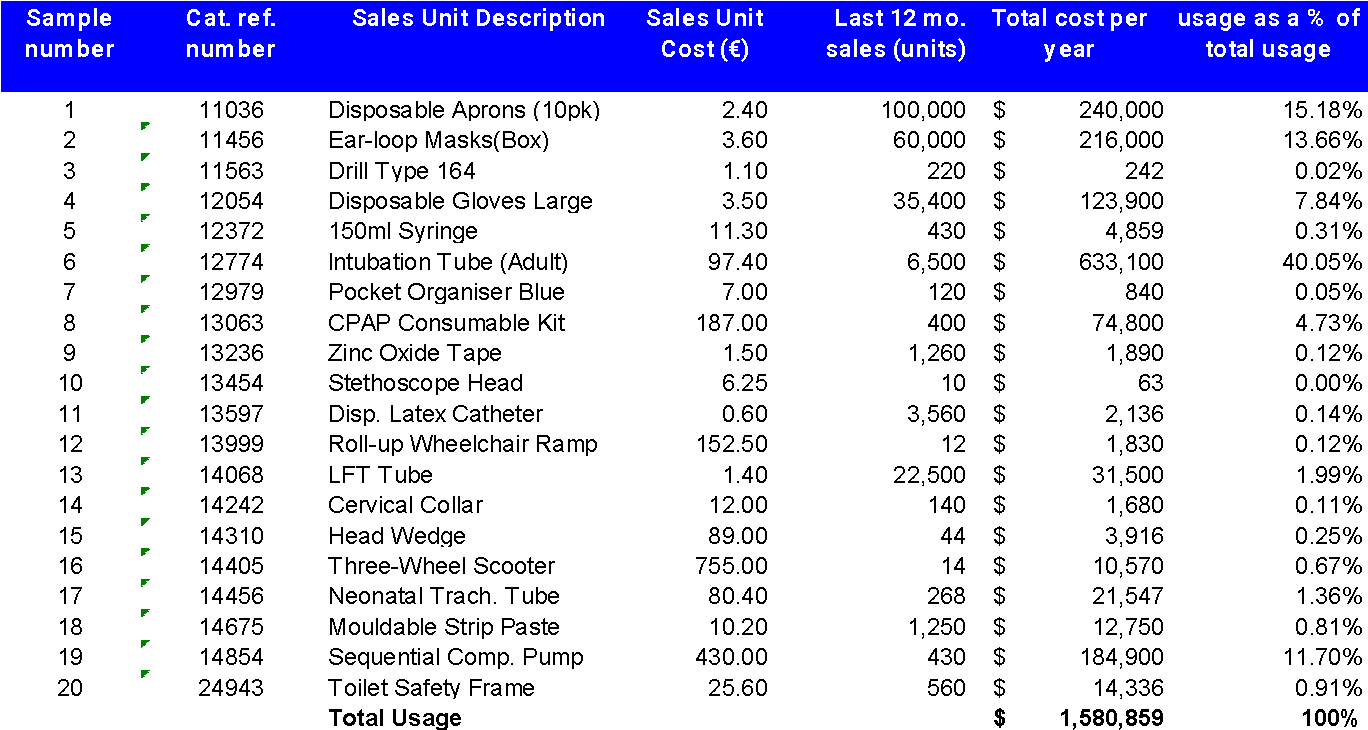
Usage as a % of total usage= usage of item/total usage
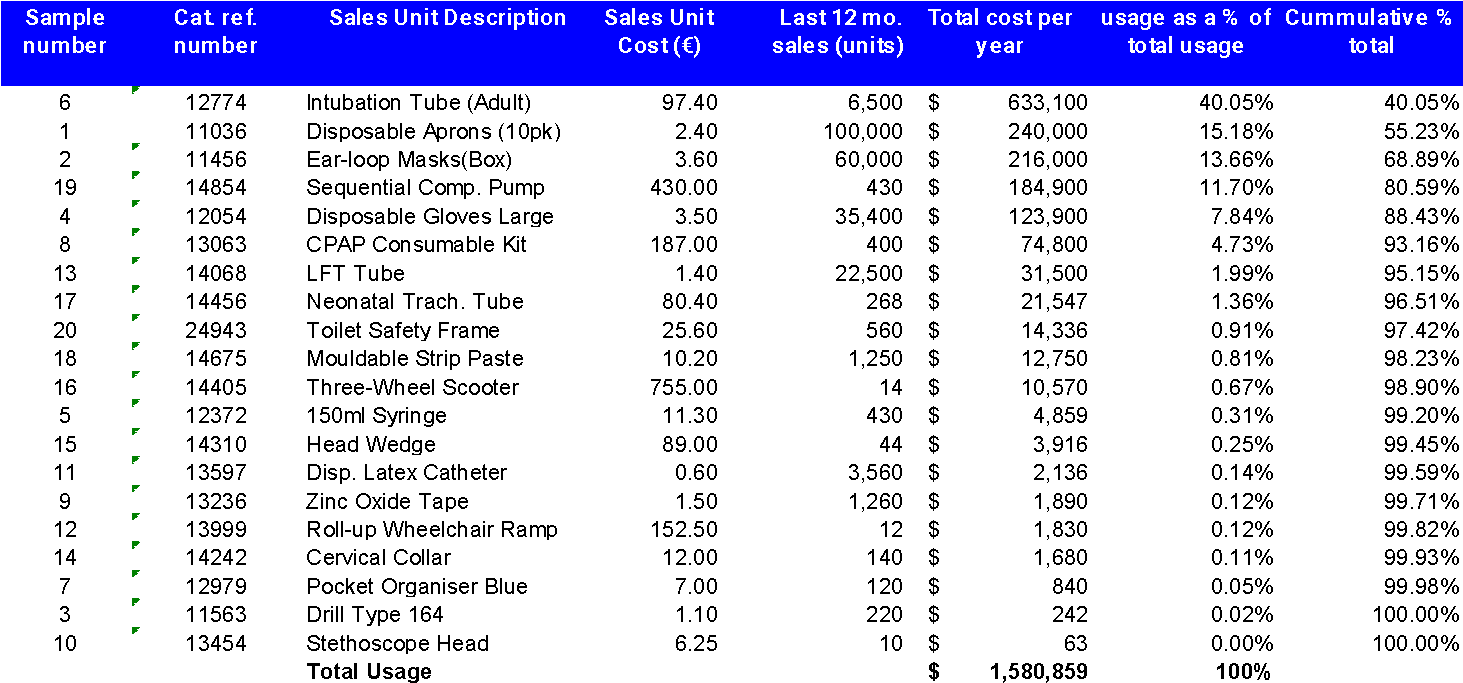


Including an A* item implies that the sample was not random; therefore, this is a clear indication that the stock items were selected based on how the pandemic affected their supply chain. Class A* was excluded in the results chart; it is more than 20% as required by the question. In addition, each class was given a treatment corresponding to its type to construct the summary table. The treatment is as discussed below.
- A-Class- This class has tight inventory control, better sales forecasts, and more secured storage areas. The items in the category also have frequent reorders and avoid stock-outs.
- B-Class- Items in B benefit from an intermediate status between A and C. An essential characteristic of Class B items is monitoring potential evolution towards class A or, contrary, Class C.
- C-Class- This class has items with less frequent reordering, and they also have 1 unit on hand. Reordering items in Class C happens when an actual purchase is made; this approach leads to a stock-out situation after each purchase, which can be acceptable. This is why C-items present low demand and a higher risk of high inventory cost.
Inventory Weeks
Inventory weeks are used to show the average amount of time it takes Waterside to sell the listed inventory (Umry and Singgih, 2019). This measure is usually expressed in terms of days instead of weeks. The calculation of inventory weeks is similar, and its formula is Inventory value / Usage value * 52.14.
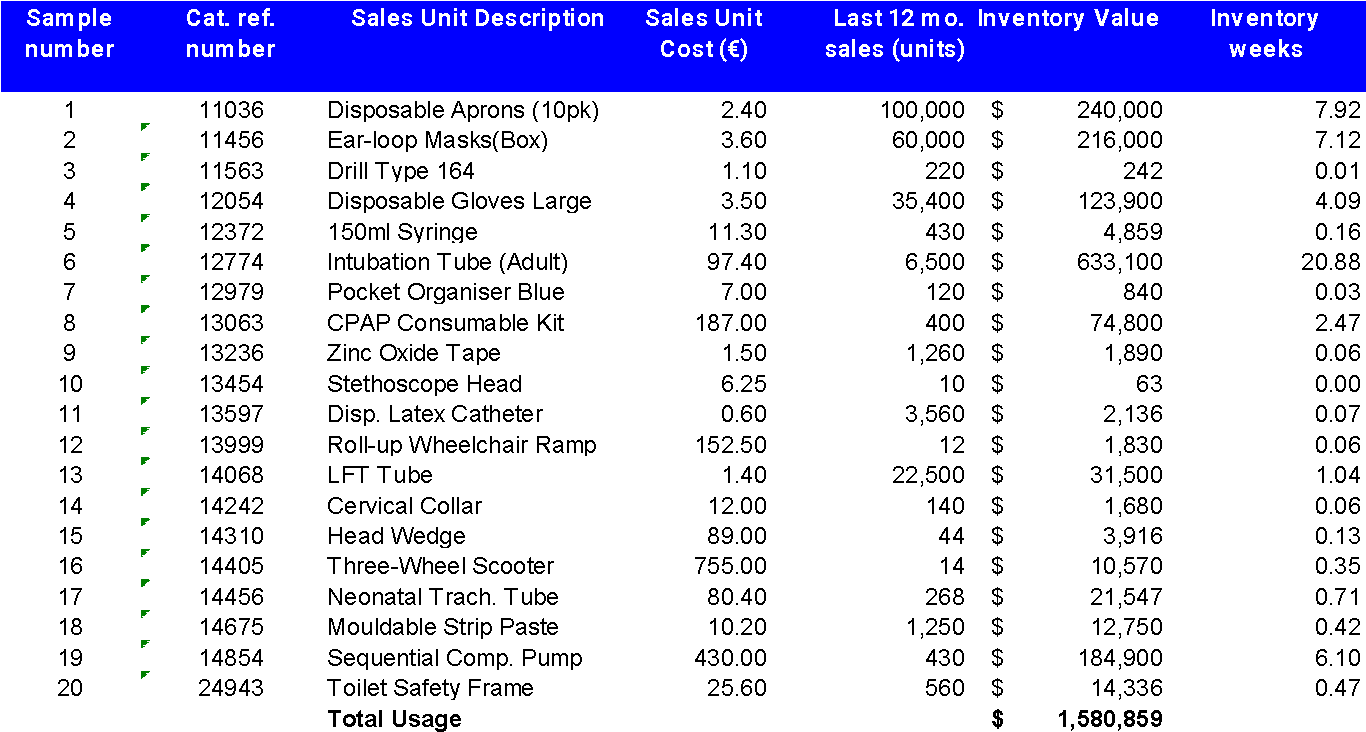


The Operations Manager’s estimate of inventory week is correct because the available stock cover of all items in total is slightly lower than the estimated ten weeks. Also referring to inventory weeks for items in Class B and some of the inventory weeks in each item have almost equal estimated weeks.
Estimate of the Overall Inventory
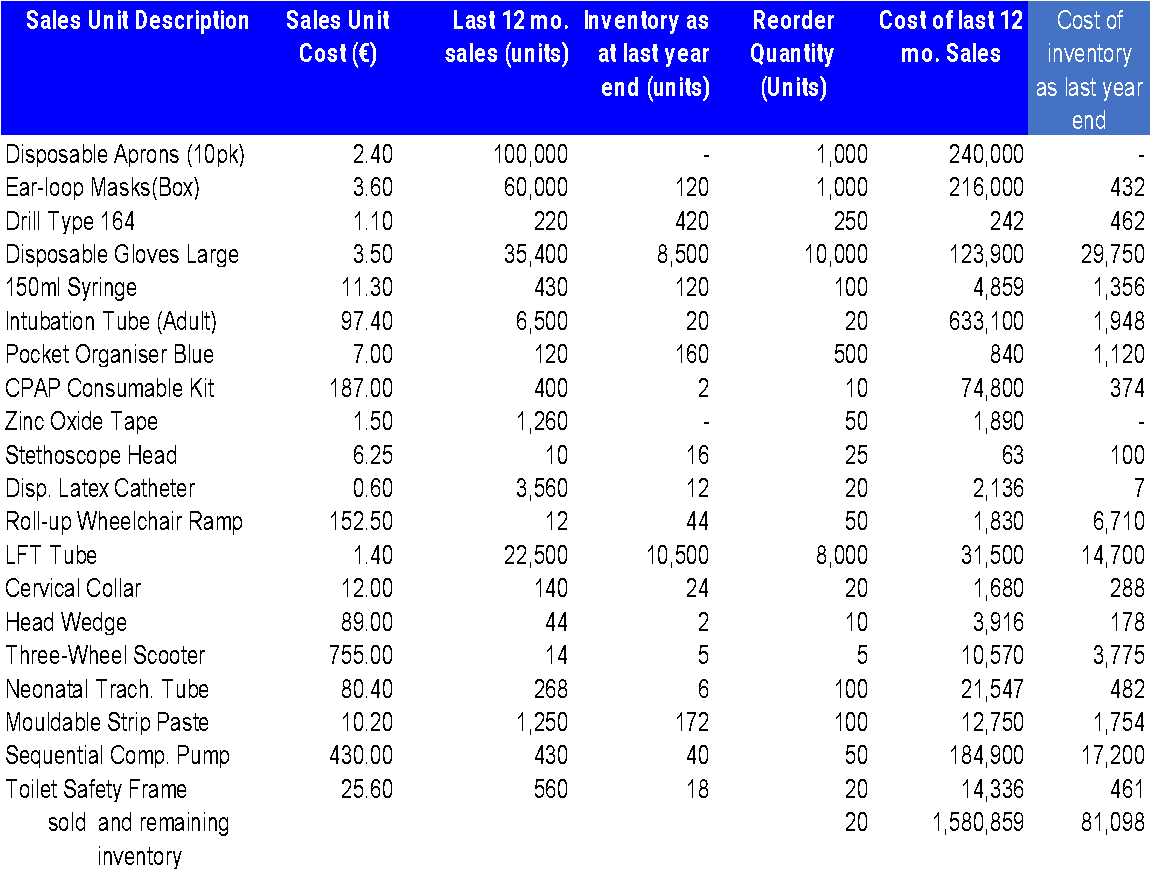
Overall inventory = Total Cost of goods sold + Total Cost of the remaining goods
Cost of goods sold= last 12 months sales x sales unit cost
Cost of the remaining goods = remaining goods x sales unit cost
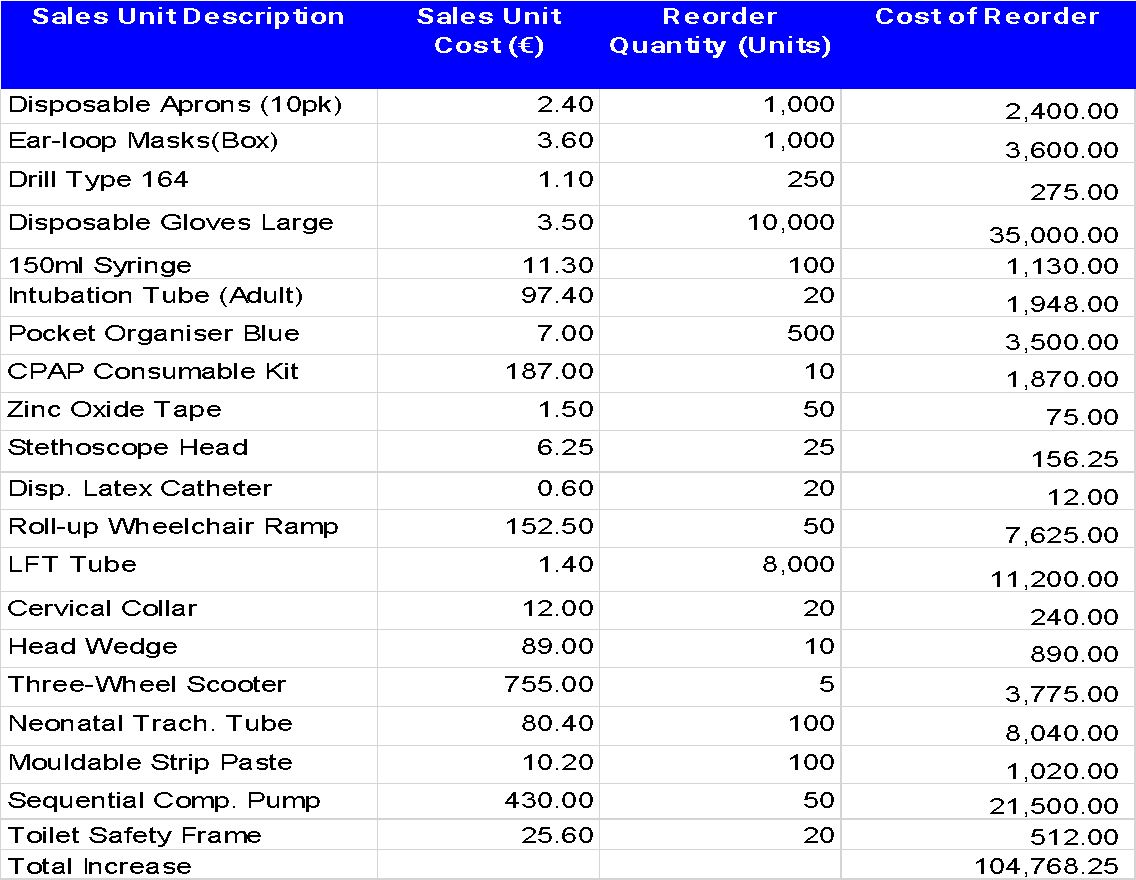
Possible increase= Total Cost of reordering
Cost of reordering = reorder quantity x sales unit cost
Causes of the Available Problem
Waterside is under the pressure of producing goods of consistent quality that satisfy their customer’s demands. However, the company is experiencing problems maintaining inventory numbers, leading to shortages and difficulties. In addition, this issue has also created severe cash flow issues for the company. Therefore, the company should realize that inventory management is necessary to handle the prevailing problem. This section aims to analyze the causes of the problem to help inventory management.
Waterside does not have an aligned inventory as well as demand planning. The company cannot forecast demand and ensure that enough material suits the customer’s demand. Caro and Sadr (2019) assert that manufacturers must align their inventory and demand planning and management solutions to have complete visibility into supply and demand within the company. However, in the Waterside case, all the systems have failed to speak to each other to integrate perfectly and handle all the required bases (Umry and Singgih, 2019). This led to the company spending a lot of time integrating software into existing systems and configuring them to operate with Enterprise resource planning (ERP) solutions and other crucial tools.
The company’s inventories are hard to find, leading to visibility issues. This has made it challenging to locate the appropriate item in the right place as quickly as possible. When it is hard to find inventory part of the supply chain for manufacturing, it usually affects the operations of the whole manufacturing process (Elias Mota et al., 2019). Further on, when the inventory stock is accessed for shipping and cannot be located, it leads to wrong or incomplete shipment and severe effects on customer satisfaction. In general, visibility problems have contributed to a powerful impact on the company’s performance.
Waterside does not have trending forecasting and centralization of its inventories. Trend prediction is crucial because it helps to manage a business. Forecasts and projections for inventory stocks are accurate when dependent on trends and actual numbers. Manual or outdated systems should not be relied on because they cannot quickly deliver reports. Waterside has been lacking updated systems that support trends and actual numbers (Gholizadeh et al., 2019). This has led to inaccurate forecasting on trends, significantly when the pandemic has distorted the demands. In addition, the company is encountering centralization issues because it deals with various inventories. Due to the pandemic impacts, Waterside was forced to expand its lists, making it more complicated for centralization. This has led to the disconnection of data, which is why the company is experiencing a stock shortage.
The company also lacks an appropriate measure of handling obsolete or excess stock. Although the demand for the company’s inventories has increased, some items have stayed for an extended time in the company’s stores (Slack et al., 2016). These items are likely to affect the overall financial health because they can no longer be sold, and the company has no methods of handing them. In addition, Waterside does not regularly look at its inventory levels and trends to maximize supply chain visibility and efficiency (Guan, Gurnani, Geng and Luo, 2019). The Head of Operations has confirmed that there are many items in the storage, and they seem to be of high rates because of the storage of large deliveries. High rates of obsolete inventory have affected the profitability and long-term viability of the company, leading to a decrease in cash flow.
The final cause of the current problem in Waterside is an inadequate inventory management system and sloppy purchasing. Inventory management that uses an inaccurate number or lacks the reporting abilities to account for the current stock increases the problem of overstocking or understocking (Parasher, Dem and Singh, 2019). For instance, Waterside has incorrect stock numbers that limit the storage of large deliveries. This leads the company to understock the items that have high demands. Further on, the company cannot monitor inventory days because head operations are guesstimating sales out of things. In addition, the company’s purchasing is not data-driven and is not closely tied to forecasting and planning (Guggenberger, Schweizer and Urbach, 2020). This has led to the Head of operations doing general forecasting without using proof of sales. Therefore, inadequate inventory management and sloppy purchasing have led to the company using inaccurate data.
Economic Order Quantity
Economic order quantity (EOQ) is a calculation meant to find the optimal order quantity for a business to minimize stock-outs, warehousing, logistics costs, and overstock costs. The reason for calculating EOQ is to offer a business numerous benefits that affect its bottom line (Guan, Gurnani, Geng and Luo, 2019). Some of the benefits of calculating EOQ are: minimizing stock-outs, improving general efficiency, and minimizing inventory. The formula for calculating EOQ is the square root of {[2*Demand*Ordering Cost] divided by Holding cost}

The perfect order to minimize cost and meet the demand for Class A* items is 2082. In addition, this demand assumes that consumer demand is constant.
Recommendation for the Company
To handle overstocking reflected on Class C items, Waterside should reduce the selling prices of all products in that class. This makes them move fast and ensures that the company reduces the loss incurred due to overstocking class C items that overstay in the warehouse. In addition, the company should reduce the production of Class C items. This will eliminate future overstocking of the inventory to create more storage for fast-moving lists such as items in A. Due to unprecedented times caused by the pandemic, ABC analysis has also revealed an increase in Class A items. Therefore, the company should focus on manufacturing more Items in Class A after creating more storage space from getting rid of Class C items. On the other hand, the manufacture of items in Class B should remain unchanged because their demand seems unaffected regardless of the supply chain being affected.
Inventory weeks have shown that most items take less than ten weeks in the warehouse when sold individually. It has also revealed that inventory of sale depending on class increases the number of weeks an inventory stays in the warehouse except for Class B items. Finally, selling items in bulk has recorded minimum numbers of weekly stock in the warehouse. Therefore, the company should consider selling its inventory because it moves faster when sold in bulk.
The company should also minimize the production of Class A* items because EOQ has revealed that 2082 items are needed to reduce costs and satisfy customers. This is crucial because it will increase the company’s revenue and profitability. In addition, this will be a financial strategy to ensure the most cost-effective way to deliver Class A* in quality, considering that they have the maximum annual usage of 40%.
Conclusion
Waterside Medical Centre’s supply chain has been affected by the break of the Covid-19 pandemic. The impact of the pandemic has led to an increase in demand for the center’s products. Due to this, the company has started to experience issues supplying to its consumers because it had not planned for such a situation. For the company to handle these issues, it should use the ABC analysis to forecast the demand of its items. In addition, it should use the causes of the available problem to detect the root causes. Further on, it should use economic order quantity to minimize costs. Finally, it should use recommendations to ensure that it comes up with a solution that will handle the entire situation.
Reference List
Caro, F., and Sadr, R. (2019) ‘The Internet of Things (IoT) in retail: bridging supply and demand’, Business Horizons, 62(1), pp.47-54.
Elias Mota, B., Cerqueira de Sousa Gouveia Carvalho, A., Azevedo Rodrigues Gomes, M., and Ferreira Dias Barbosa‐Povoa, A. (2019) ‘Business strategy for sustainable development: impact of life cycle inventory and life cycle impact assessment steps in supply chain design and planning’, Business Strategy and the Environment, 29(1), pp.87-117.
Gholizadeh, N., Gharehpetian, G., Abedi, M., Nafisi, H. and Marzband, M. (2019) ‘ Innovative energy management: a framework for cooperative operation management of electricity and natural gas demands’, Energy Conversion and Management, 200, p.112069.
Guan, H., Gurnani, H., Geng, X. and Luo, Y. (2019) ‘Strategic inventory and supplier encroachment’, Manufacturing & Service Operations Management, 21(3), pp.536-555.
Guggenberger, T., Schweizer, A. and Urbach, N. (2020) ‘Improving inter-organizational information sharing for vendor-managed inventory: toward a decentralized information hub using blockchain technology’, IEEE Transactions on Engineering Management, 67(4), pp.1074-1085.
Nalliveettil, G. (2021) ‘Examining the effectiveness of the think-aloud procedure and reading strategy inventory: insights from reading process research’, Journal of Language Teaching and Research, 12(6), pp.899-910.
Oh, S., Min, H., and Ahn, Y. (2021) ‘Inventory risk pooling: a strategy for the food distribution network in Korea’, European J. of Industrial Engineering, 15(4), p.439.
Parasher, L., Dem, H. and Singh, S. (2019) ‘Optimal strategy for an inventory model based on agile manufacturing under an imperfect production process’, International Journal of Mathematics in Operational Research, 14(1), p.106.
Slack, N., Chambers, S., Johnston, R. and Harland, C. (2016) Operation management. 7th ed. London, United Kingdom: Pearson Education, pp.495-536.
Umry, T. and Singgih, M. (2019) ‘Inventory Management and Reorder Point (ROP): strategy using ABC analysis methods in textile manufacture’, IPTEK Journal of Proceedings Series, 0(5), p.1.
