Introduction
The primary purpose of the analysis provided in this paper is to determine if the average price per square foot in the Pacific region is below the value of $280. In order to test for the average price, a random sample of 750 entries from a dataset that included 1,000 houses from the Pacific region was selected. The sample was obtained using Microsoft Excel by creating a new column with a random number, sorting the list of entries according to the random number, and selecting first 750 entries. The random numbers were assigned using randbetween(1; 1000) command. The Regional Real Estate Company’s marketing plan is predicated on the assumption that the average price per square foot in the Pacific region is $280. Should the actual price per square foot fall short of this figure, the company could end up overspending on marketing.
Hypothesis Test Setup
The population under analysis is the price per square foot of the houses in the Pacific region. The null hypothesis is that the population mean for the parameter is $280, while the alternative hypothesis is that the population mean is less than $280. The hypotheses can be written the following way:
- H0: μ=280
- HA: μ<280
The hypothesis will be tested using a single sample t-test. The test will be left-tailed, as the hypothesis has the ‘<’ (less than) sign.
Data Analysis Preparations
Before conducting hypothesis testing, it is beneficial to calculate the descriptive statistics. Descriptive statistics usually includes mean, median, mode, standard deviation, skewness, kurtosis, and range. The descriptive statistics for the sample calculated in Microsoft Excel are provided in Table 1 below.
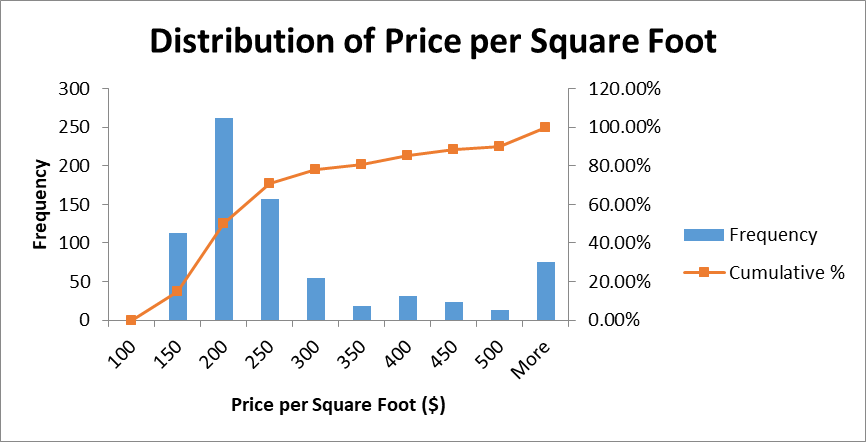
The mean of the sample of 750 observations was $259.31 with a standard error of 5.8. The median was $200.18 and the standard deviation was $158.78. The histogram of the distribution of values is provided in Figure 1 below.

The sample has an approximate normal distribution curve with a long right tale. The center of the shape is between $200 and $250. The distribution was positively skewed and leptokurtic.
In order to conduct a statistical test, it is crucial to identify the significance level at which the null hypotheses should be rejected. This research will use a significance level of α =.05. Additionally, the reliability of a test is dependent upon the dataset not violating the assumptions. Single-sample t-test is associated with four assumptions, including normality of data distribution, independence of the observations, absence of significant outliers, and the variable should be continuous in nature. All the observations in the sample are continuous in nature and the observations are independent. However, there are significant outliers, as there are values higher than 2.5 standard deviations from the mean. Additionally, the skewness of 2.16 demonstrates that the assumption of the normality of distribution may be violated.
Calculations
The sample’s mean is $259.31 with a standard error of 5.8. In order to test the hypotheses, left-tailed single-sample t-test was used. Single sample test statistic (t) can be calculated using the following formula:


The p-value was calculated using the T.DIST function in Excel. The p value was 0.0002. In other words, the p value of the test statistics would be placed in the left tail of the normal distribution curve.
Test Decision
The p value (0.0002) was higher than the significance level of 0.05, which implies that there is significant evidence to reject the null hypothesis. Therefore, the null hypothesis was rejected and the alternate hypothesis was accepted.
Conclusion
The test result demonstrate that the hypothesis should be accepted which implies that there is significant evidence to claim that the mean price per square foot was below the estimated average of $280. Thus, the claim made by one of the company’s Pacific region salespeople is true and the marketing company should not assume an average price per square foot of $280. Therefore, it is crucial to redesign the marketing campaign to ensure that the true population’s mean is used. The populations true mean is below the $280 mark with a 99.9% certainty.
