Introduction
Financial statements are the mirror of a company’s success and performance, which also help in decision-making and predicting outcomes. Without this documentation, tracking organizational performance is impossible. No changes or innovations come without a preliminary analysis of financial resources and expenditures, which allows the accurate assessment of corporate capabilities. Therefore, companies should always analyze their financial data to monitor revenue and profits and predict the feasibility of new products.
Main body
As a starting point, it would be useful to remind why data analysis is crucial for any company. First, financial data facilitates reasonable decision-making because any potential initiative within a company should be based on facts reflecting its current economic state (CompTIA, n.d.). Second, data analysis helps to track key performance indicators (KPIs), such as revenue or profit generated (CompTIA, n.d.). Finally, it allows the detection of fraud in the turnover of revenue.
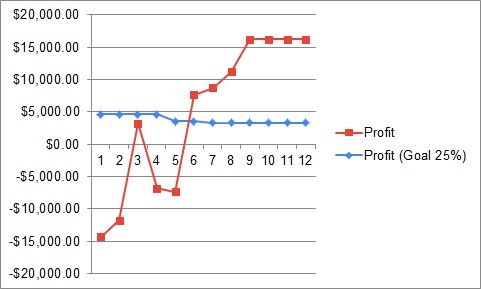
Results of data analysis have shown that the company has made a significant advancement during the year. Although no profit was made for the first six months, it increased the planned 25% of COGS in the second half of the year, which is evident from Chart 3. Having the data visualized in graphs, one can identify the factor that impacts profit growth. Moreover, it can help understand whether the new product is worth continuing.


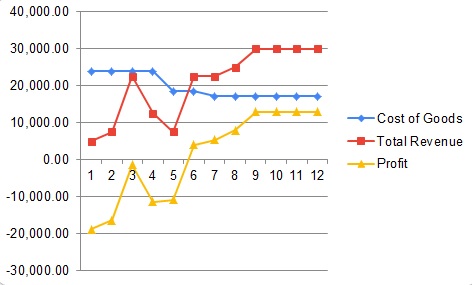
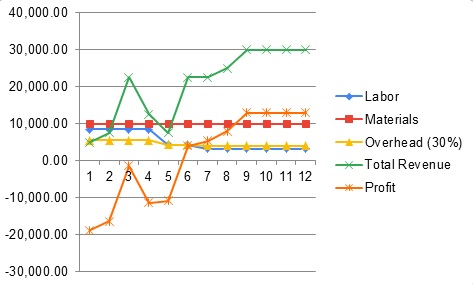
The findings represent the correlation between a decrease in the cost of goods sold (COGS) and the growth of revenue and profit, as shown in Chart 1. Chart 2 provides a more detailed description of COGS components, including labor, materials, and overhead. The expenditure on materials remained stable over the entire period, while labor costs slightly dropped along with overhead. Remarkably, the profit increased a little once the labor costs fell between the fourth and fifth months. Thus, the company can continue its new product, but it will be necessary to make a forecast because the profit indicator is on the plateau and may drop due to external factors, such as decreased demand for the product. The kind of graphic used is the line chart, as it allows observing the annual dynamics of cash flows. Line charts are frequently used when one needs to see the changes over a particular period.
Adding visual representation substantially changes the perception of information, especially in the case of figures. During the presentation of current findings, viewers may find it difficult to comprehensively understand what is said if speech is full of five-digit numbers. In addition, visualization helps to observe the correlations of variables (Stark, 2020). Moreover, further joint discussion of findings and decision-making can hardly be possible if participants have no visualization in front of them.
The target audience significantly impacts the way the information is displayed. For instance, when presenting the data to shareholders, it is possible to add more particular details that would be interesting to this group of viewers. The data currently shown in the charts is sufficient for employees to see an overall pattern of costs, revenue, and profit. In any of these cases, the audience will see precise and analyzed data without the need to study it independently.
Conclusion
To conclude, the analysis of the COGS, revenue, and profit has been performed to determine the feasibility of continuing a new product. It has been found that the company received no profit in the first half of the year, but the profit increased later and exceeded the estimated 25% of COGS. Data visualization has been used to present the already analyzed data conveniently and transparently for viewers. It is critical to use charts and graphics as it allows observing patterns and correlations over a specific period.
References
CompTIA. (n.d). How is data analytics used in finance? Web.
Stark, M. (2020). Why data visualization is important. Analytiks. Web.
