Introduction
The automotive industry in mature car markets, such as the European car market, has been at the forefront of embracing innovation (Laux, 1992; Cornet et al., 2019). In particular, one of the significant trends that need to be reckoned with was the digitization of production processes that was made possible largely due to the general advancement of technology (Brochure: Digitising European industry, 2016). According to the European Commission (2020a), digitization serves a variety of goals. It helps to transition to a smart economy, create the next generation of products and services, and enhance innovation capacity across the board. As per the data provided by the European Commission (2020b), digitization will boost EU GDP by 110 billion annually. One of the areas that would benefit immensely from digitization is supply chain management. In the modern age, supply chains have to respond quickly to the market to survive and meet customer needs, which leads to the formation of a new supply chain management model (FinancesOnline, 2020).
In this project, it is hoped that an operational simulation game that acts as a car manufacturer can be used to investigate how it can respond to the market. Data such as sales results and competitive manufacturers’ sales results to improve the production line in order to increase sales and revenue. Therefore, in the present business game, I seek to find the role of data management for the supply chain management. Thus, the individual topic for this assignment may be formulated as “Supply chain data management to enhance market strategy decisions in the European automotive industry.” I set the following personal objectives to guide my research:
- to review key contributing factors to decision-making in the automotive industry;
- to compare the differences between data-managed supply chains and traditional supply chains;
- to find out what digital management can do to improve supply chain management and try to conclude a model for the operation of a digitally managed supply chain system.
The main body of the present paper is organized into three main sections: literature review, methodology, and business game analysis. The literature review explains my motivation for the individual research topic, introduces the basic concept of data management, and analyzes the role of data management in supply chains as per recent literature. In turn, in the methodology section, I describe the selected research methods as well as my approach toward data search and collection. Lastly, to usher the reader into the business game analysis, our team structure and communication are outlined, followed by the analysis of the most significant rounds of the game.
Literature Review
Motivation for the Individual Research Topic
In this game, each team represented a car manufacturer competing in the vibrant European car market. However, we were trying to only approximately simulate real market conditions. For this reason, I found it useful to research statistics and literature on the state of the European automotive industry with a special focus on the United Kingdom. According to Leonte and Orszaghova (2013), the European car market takes up about 50% of the global car market, remaining an undisputed leader since the late 1990s. As reported by the International Council on Clean Transportation (2019), car sales in Europe remain stable at 15.1 million annually, only coming second to China (Jato, 2019). Three out of ten world’s top car manufacturers are based in the EU – those are Volkswagen, Mercedes, and BMW (Wagner, 2020).
Among European economies, the United Kingdom ranks third after Germany and France: their respective market shares, when estimated on the global scale, are 18.1%, 4.5%, and 1.8%, respectively (Koptyug 2020; Marklines, 2020). For the United Kingdom, these figures are reflective of great achievement. The country used to lag behind its neighbors in terms of high-quality manufacturing, but in recent decades, it was able to rebuild its reputation as an economy that produces reliable vehicles (KPMG, 2017). Indeed, with its rich traditions, high-caliber workforce, and innovative know-how, the European automotive industry keeps its competitive edge.
Nevertheless, the question arises as to what the European car industry will have to undertake to remain in the leading position. Cornet et al. (2019) predict that fundamental changes in the inner workings of the industry across the board can shake Europe’s leadership. According to Christensen et al. (2015), it is disruptive innovations that reign supreme on the current global market. The scholars define disruptive innovation as innovation introduced by new entrants to the market that challenges well-established incumbent businesses. Those involved in automotive supply chains felt the profound impact of disruptive technologies: the rise of artificial intelligence, the advancement of the IoT (the internet of things), and the spread of blockchain solutions (The 5 most disruptive supply chain innovations in 2018, 2019). To put things into perspective, recent estimates show that the majority of global automotive revenues will stem from disruptive business models, especially those that revolve around data.
These facts leave questions as to what companies can do in the current climate. FinancesOnline (2020) surveyed top supply chain performers to understand their way of approaching disruption. Only 22% of them advised becoming a disruptor while the rest emphasized the need to improve efficiency, build resilience, and quickly respond to market challenges. FinancesOnline (2020) also provided the perceived best tools that should take priority when seeking to resist market competition fueled by disruption. As per the survey answers, data analysis takes the lead (41%) followed closely by IoT (39%) and cloud computing (39%).
Indeed, the disruptive model does not and should not fit every company’s agenda. However, what can be controlled is how a company steers its strategy and positions itself against others using available tools. One such tool that I took a particular interest in is data management for the supply chain management. For this reason, I chose supply chain data management as an individual topic for the current business game. Below I support my hypothesis that it does improve business performance with relevant literature.
The Basic Concept of Data Management
First and foremost, data management is an administrative process that deals with all kinds of data relevant to a company’s business activities (Easterby-Smith, 2019). This process can be broken down into several parts: collecting, validating, storing, protecting, and processing data (Kleinman & Horton, 2014; Zozus, 2017). To serve the needs of a company, data needs to be reliable, accessible, and timely. Industry players put data to use to steer the direction of their business development by making informed decisions. Data serves as evidence from the real world that reflects trends, threats, and opportunities. It is important to point out that data does not come in an interpretable way. As Vaderplas (2016) puts it, it needs to be “relaxed” so that it allows us to gain any meaningful insights.
Below is a table of key benefits of data management as outlined in recent literature on the topic (see Table 1).
Table 1. Key benefits of data management for supply chains
As seen in Table 1, some authors focus on particular aspects of supply chain management that data management helps to improve while others consider supply chains on the whole. To conclude the findings, it is apparent that the use of data has the potential to enhance every element of supply chain management. According to Christopher (2011), its four major elements are integration, operations, purchasing, and distribution. They are interrelated and depend on each other: a disruption in one element may hurt the performance of others. Conversely, like Waller and Faucet (2013) point out, progress in one area may mean leveling up in others as well.
For all the benefits of data management, it is important to consider the challenges that come with the introduction of this tool. There are the following difficulties to be addressed:
- Volume: the size of the data. As mentioned before, today, it is not uncommon to encounter the magnitude of data larger than previously dealt with within a particular industry – in this case, these data qualify as “big data.” The size of data these days can be explained by the possibility of streamlining constant updates and the speed with which data becomes outdated and, thus irrelevant (L’heureux, 2017);
- Variety. Data that is used by industries today is non-uniform. In fact, it comes in a variety of formats ranging from traditional structured, numeric data to unstructured text documents, video, and audio files (Labrinidis & Jagadish, 2012). Data management that would consider all the various data types is still a challenge that many companies are grappling with;
- Variability. Jin et al. (2015) point out an additional layer of complexity created by changes in the data flow. Scholars explain that there are peak data loads triggered by certain events – political, social, or economic. Variability is a difficulty to overcome when building data mining and processing pipelines;
- Value. There exists plenty of noisy information that does not add any value, though it consumes time and human resources (Jin et al., 2015). A person responsible for data management has to understand what data could be omitted without hurting its insightfulness and integrity;
- Complexity. Data comes from a variety of sources, which makes it necessary to understand their hierarchy, interrelations, and connections.
Data Management in Supply Chains
Today, supply chain market size is only growing, showing promising prospects for all companies involved. Ross (2020) reports that for more than half of surveyed companies (57%), supply chain management means a competitive advantage over contenders and an impetus to further business development. Supply chain management has come to prominence largely because industries are becoming increasingly customer-centered (Holtzblatt & Beyer, 1997). Indeed, customer preferences are becoming more refined as they enjoy the freedom of choice and low switching costs. Therefore, some companies find it harder to retain clients if they fail to tailor buying experiences to their needs.
According to Ross (2020), 70% of industry professionals (70%) consider supply chains as the main driver of enhanced customer service in 2020. For the automotive industry, it means responding quickly to market changes, producing models that are high on demand, and taking feedback from customers into consideration. Besides, supply chain management will help with discovering and revolutionizing the distribution aspect of the car industry (Deloitte, 2015). This is even more relevant given that today, experts are convinced that the traditional car dealership that has long accompanied the automotive industry might as well become obsolete.
Ideally, supply chain management needs to equally benefit both producers and customers. It goes without saying that reaching this balance is not an easy fit. Pandering to customers’ needs with no regard for profitability hurts business, while the opposite means losing the competition to contenders and pushing customers away. Ross (2020) inquired industry professionals about what could increase supply chain spending. Interestingly enough, the most popular reply is exactly in line with the hypothesis of this study. As found by Ross (2020), 25% of companies name cutting costs as the key solution to inefficient spending. Data analytics takes third place, with 10% of surveyed participants giving them a priority. Drawing on these facts and figures, one may conclude that building cost-efficient models through data might be the answer to the challenges of the automotive industry.
In light of the topic, it makes sense to define the term that has recently become a buzzword in the tech world – “big data.” Simply put, big data is a large volume of data whose manual processing would be tedious with the use of traditional statistical and mathematical methods (SAS, n.d.). Today, big data makes a lot of promises to the business world, and many industry leaders are already bedazzled with its potential. Baryannis et al. (2019) outline some perspectives on the use of big data in supply chain management. A large amount of data helps to finely tune machine learning algorithms as more data points can be more or less associated with a better chance at precision. Ideally, when processed with the application of cutting-edge methods, big data can help with the synergy between AI (artificial intelligence) and supply chain experts. Together, they analyze factors that contribute to decision-making: return on investment, impact on the brand, effect on resources, potential risks, and lost opportunity costs.
Thanks to the increasing means of data transmission, supply chain management with the aid of big data analytics are already being used in a number of new industries (Sanders, 2015). The US e-commerce giant Amazon is a prime example of a company that owes its aggressive growth to big data. Data management boosted its sales, improving the user experience, and even capturing nearly 50% of the market share of US e-commerce platforms (eMarketer, 2018). To recapitulate, data management continues to revolutionize supply management, allowing companies to ever resist disruption or become disruptors.
Methodology
Research Methods
The first stepping stop toward the completion of this assignment was a thorough literature review. Literature search provided a solid foundation of knowledge on the subject matter, highlighting the relevance of the chosen individual topic (DePoy & Gitlin, 2019). Since the game only roughly simulated reality, it was critical to understand the actual state of the European car market and the challenges it seeks to resolve. Besides, the literature review confirmed the recognized role of data management in supply chain solutions, backed up by both industry reports and academic, peer-reviewed articles. At the same time, a thorough reading helped with identifying the limitations of data-fueled efficiency and showed that data management in itself is not perfect. What defines the success of its application is the ability to tell relevant, high-quality data from irrelevant and interpret findings.
Generally, there are two primary research methods that are not unique to supply chain management studies: qualitative and quantitative (Ghauri et al., 2020). As explained by Ghauri et al. (2020), both qualitative and quantitative methods have their advantages and disadvantages. If a mixed method that amplifies the strengths and mitigates the weakness of the two is not reasonable, then the appropriateness of the method depends on the objectives of the research. The primary objective of the present study is to measure the impact of data management on supply chains in terms of production costs, sales numbers, and other factors. All this information is quantifiable; moreover, that is exactly the form in which it is retrievable from the business game.
Since I chose quantitative research methods for this research, I will be able to enjoy all the benefits that they present. Firstly, with quantifiable data, insights are more generalizable. This is a plus since one of the research objectives is to try to conclude a model for the operation of a digitally managed supply chain system. Besides, quantitative research methods allow for better objectivity and accuracy since subjective interpretation and the human factor may be a barrier to making sense of qualitative data.
Data Search and Collection
Data search and collection is a critical aspect of any research that often decides the validity and reliability of results. Improved data quality means improved decision-making, be it in an academic setting or a corporate environment. Conversely, “noisy,” irrelevant, and outdated data skew results, which may be misleading if not dangerous when making important decisions (Moreno, 2017). The literature section addressed the problem of processing big data and its requirements for advanced statistical methods, the application of computational models, software, and hardware. However, these tools are only part of an equation, and no amount of effort and investment can make sense of poor-quality data with unreliable figures and numerous missing points (Fan et al., 2014). For this reason, it was imperative to gather reliable data to proceed with this research.
The data used in this research can be categorized into external and internal. The key findings from external data are presented in the literature review section. External sources helped to identify the characteristics of the larger context, understand the state of supply chain data management, and realize its promising prospects and drawbacks. Internal data are exclusively sourced from the business game and cover a variety of aspects of car production and distribution.
The Process and Analysis of the Business Game
Game Process and Roles
For this simulation game, we were divided into teams, each of which represented a company competing on the European car market. The impact of the COVID-19 pandemic made the teamwork somewhat more complicated as my team members and I ended up in different time zones. For this reason, we had to put an even larger emphasis on the organizational structure and communication to make sure that we complete this task successfully. We could not meet offline, and because of that, we had to make the best out of our online meetings. Our team could not afford to analyze all the metrics in one sitting – this would be a waste of time. Therefore, we unanimously decided that it would be best to assign each member to report the most important findings from their area of expertise. This way, we were able to keep presentations concise and our meetings productive, weaving only the most useful insights into our strategy.
Apart from that, our team was very diverse, which also required some adjustments from each member. On the one hand, diversity can be a strength as it allows the team to look at the problem from different angles and take up a variety of perspectives (Kochan et al., 2003; Koponen & Julkunen, 2017). On the other hand, some conflict of opinion was unavoidable. Because of the fact that we come from different parts of the world, we had different perceptions of how cars are produced and sold. Therefore, it was a challenge to come to a consensus regarding production strategies. We tackled this issue through the division of labor and role assignment that would amplify the strengths of each member.
Eventually, our team decided to be divided into five sections: Marketing, Product, Finance, Sales, and Human Resources. I was mainly in charge of the product department, and my key responsibility was to adjust the production line according to the feedback from the marketing department. During the simulation, I collaborated with other team members to continually change our production and factory management strategies in response to sales data. In particular, I sought to pinpoint which types of data, when put to use, had the most significant impact on production costs.
Business Analysis
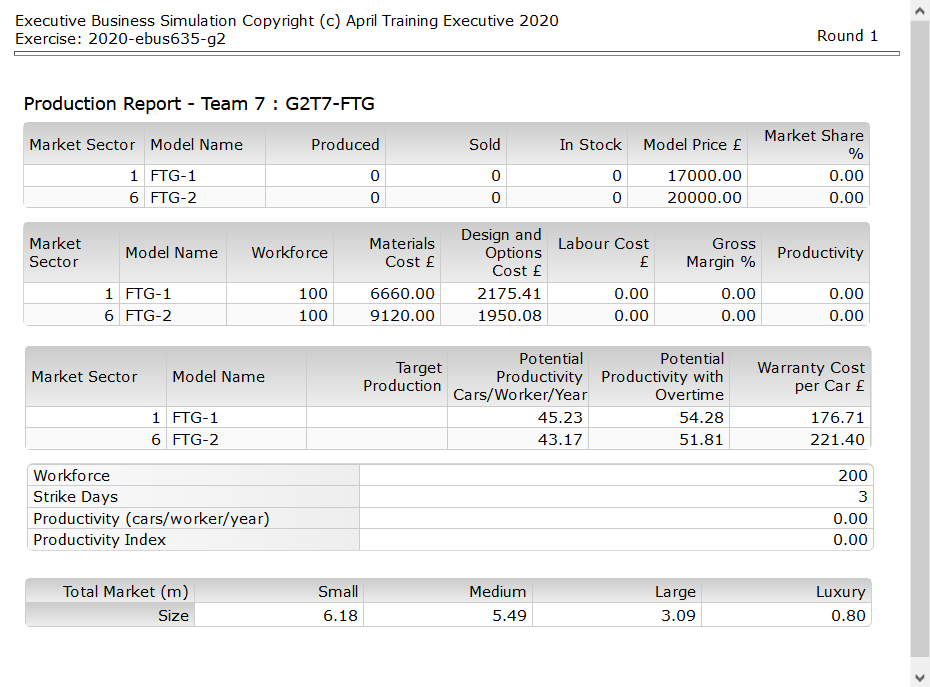
The present business analysis focuses primarily on Rounds 1, 2, 3, 5, and 9 as our team made the most impactful decisions during them. The beginning of the business game was challenging: I did not have any data to draw on, and we had to make decisions with barely any sense of direction. The only piece of information that guided us during the first round was the market size of different segments (see Table 1). Since small (6.18%) and medium (5.49%) cars seemed to be at the peak of popularity, we made them our initial product. Unfortunately, the production line configuration time was too tight and production could not be rationalized, resulting in poor sales.
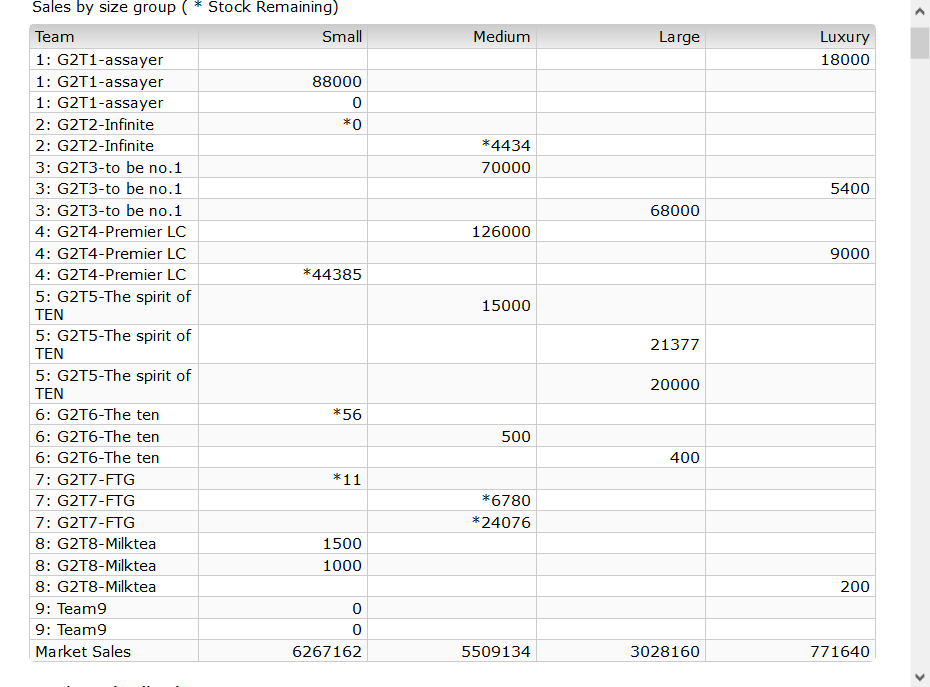
Round 2 and Round 3 were more fortunate and eventful for our team. After the business game took off, we had more data at our disposal to learn more about the context in which we were competing. Table 2 demonstrates that market sales for small cars were high across the board, which had not changed since Round 1. However, this time we decided to be more strategic and quickly respond to market trends. We added a new production line for small cars and made reasonable arrangements for the production line configuration. Since during Round 2, we put more thought into our decisions, the sales figures improved greatly.
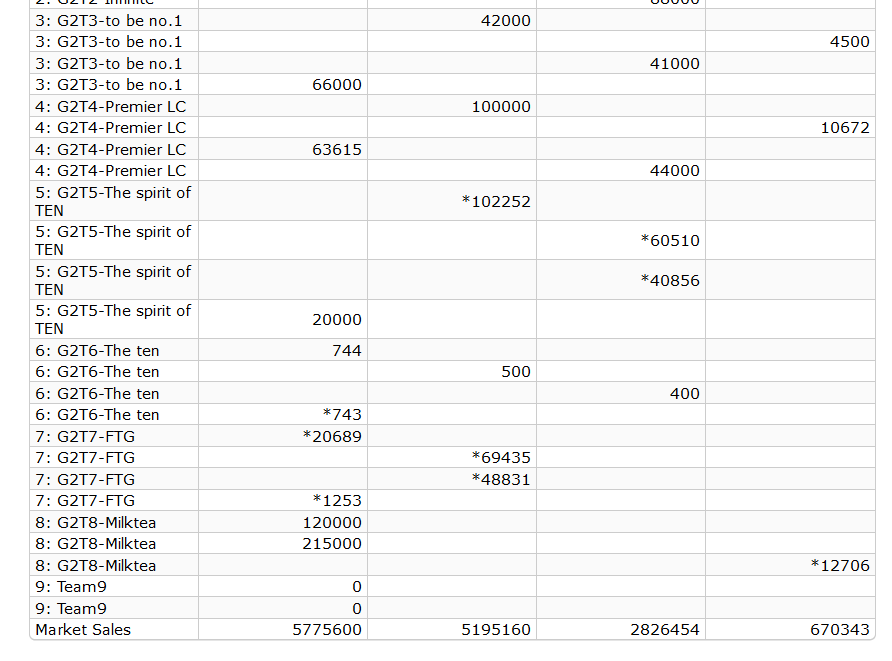
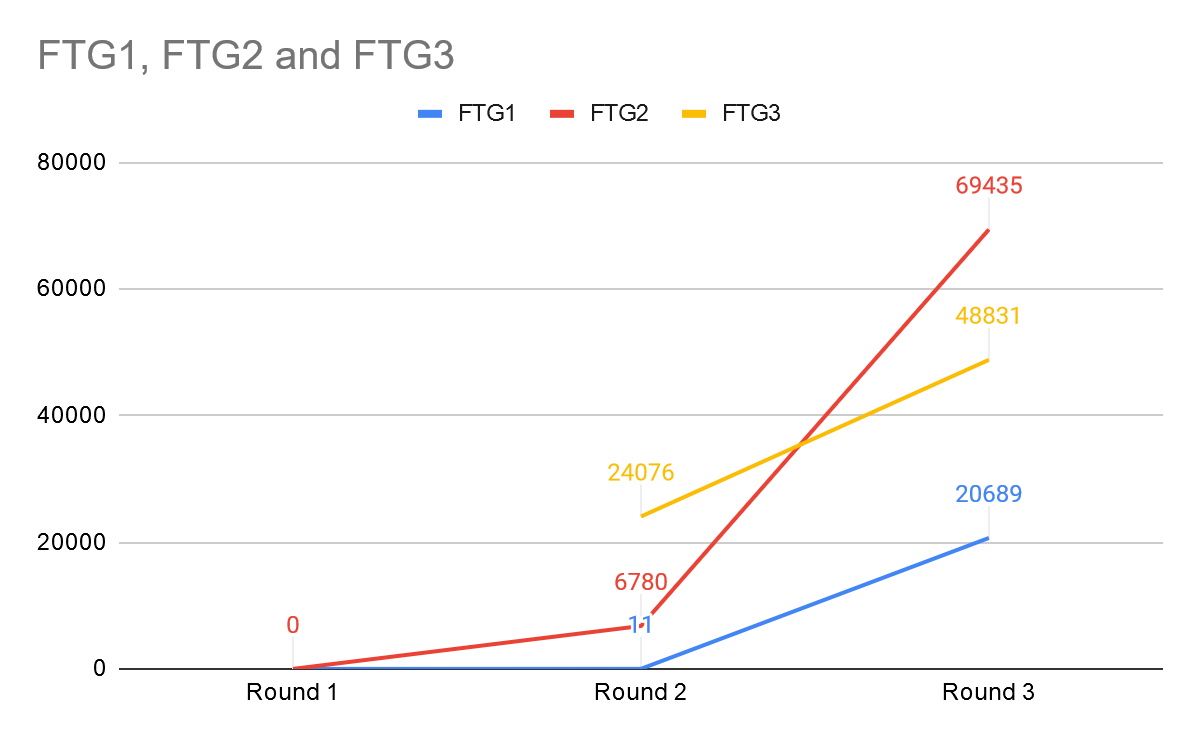
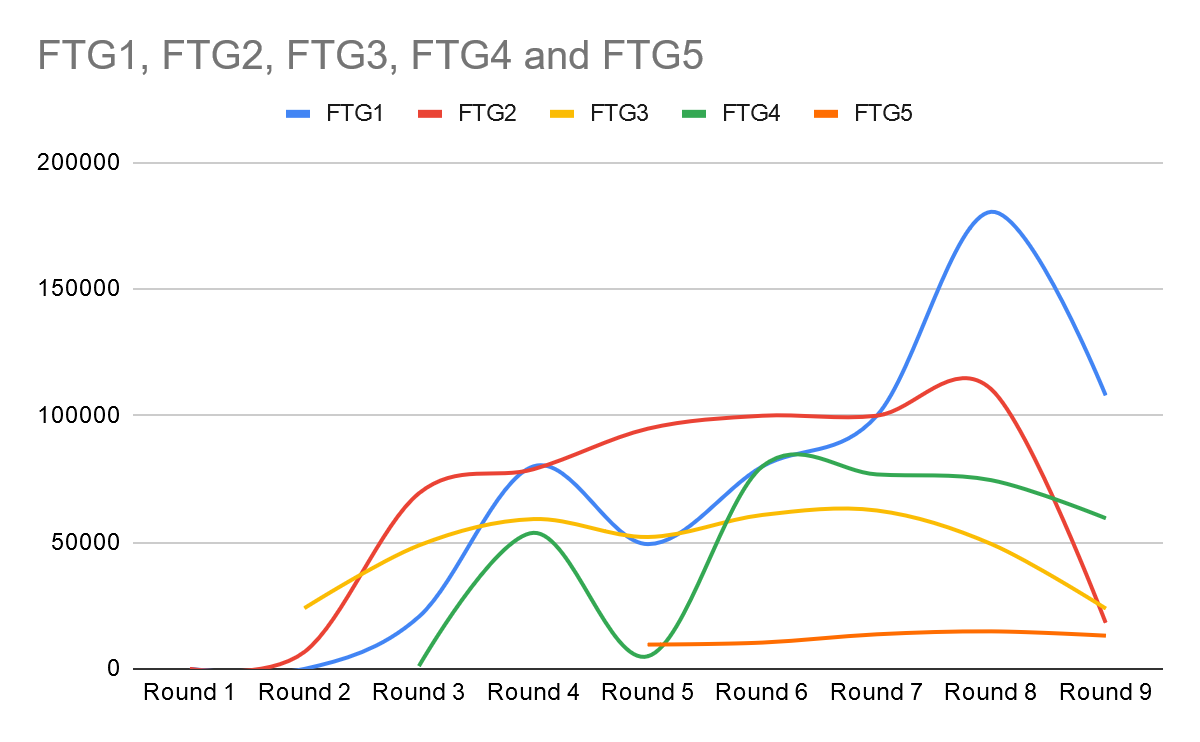
The trend persisted for Round 3, so we did not make any significant changes to our strategy (see Table 3). Graph 1 shows sales volume dynamics and positive trends that we were able to observe after the renewed product line configuration for each and every model. Interestingly enough, the surges in sales were not completely motivated by our price leadership. Indeed, we lowered prices for FTG1 (from 17,000 to 15,000, and 12, 999) and FTG2 (from 20,000 to 18,999). However, the price for FTG3 rose from 17,999 to 20,000, and yet, the sales volumes doubled. Together with the Marketing department, I figured that price leadership was not the end-all-be-all of marketing. Responding to customer preferences and learning from the competitors was a far more superior strategy.

Overall, the first four rounds did not disappoint us, and yet, we were at risk of stagnating. As mentioned in the literature review, ultimately, data management in supply chain management serves the client. Therefore, we decided to tweak our production to make our production configuration more customer-centered and learn customer preferences from first hands. That was around Round 4 that we discovered the Popularity Factors tab (see Table 4). The tab reflected in detail customer preferences for various options and specifications by age group, which we took into consideration.

In the fifth round, as there were not many competitors for luxury models, and there was a large profit margin, the last production line was decided to be for luxury models. Subsequently, the production and configuration of the line were dynamically adjusted based on sales results and inventory levels. Later, we realized that tapping into the luxury segment gave us a competitive advantage over the teams that had already established their presence there. As we concluded from previous rounds, price did not always correlate with sales volume. However, price leadership on the luxury vehicle market could allow us to create a so-called “blue ocean.”
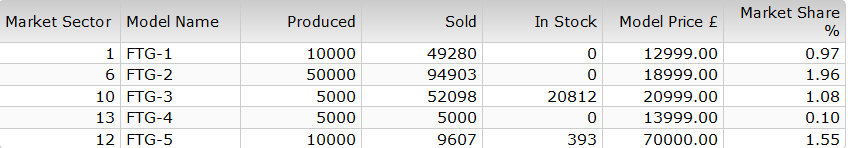
The “blue ocean” strategy suggests that there are unexplored market areas while the “red ocean” strategy is based on environmental determinism. “Read oceans” signifies a limited market where one company increases its market share at the expense of another. Essentially, the BlueOcean Strategy reframes market competition. It implies that the boundaries of the market size are arbitrary, and new companies can create “blue oceans” themselves. After a thorough data analysis, I realized that we were not able to produce a lot of luxury cars at once. We set the number at 10,000 and also sold them for a lower price. What also differentiated our models was their superior configuration, which also allowed us to limit the sales volume of other teams in the selected segment. Out of the 10,000 cars we produced, we were able to sell 9,607, which was big progress (see Table 5).
Our team was satisfied with the results of Round 5, which is why for some time, we committed to the same strategy and refused to make any major changes. For Rounds 6, 7, 8, we kept the same car settings and only occasionally experimented with output but not other options. From our observations, other teams were making bolder moves, introducing new models, or dramatically changing configurations. Conversely, we were approaching competition conservatively and saw stable but far from impressive results. However, soon we noticed that sales volumes for the majority of the models were stagnating or decreasing (see Graph 2). As seen in Graph 2, even FTG1 which had been consistently showing good results started losing its positions.
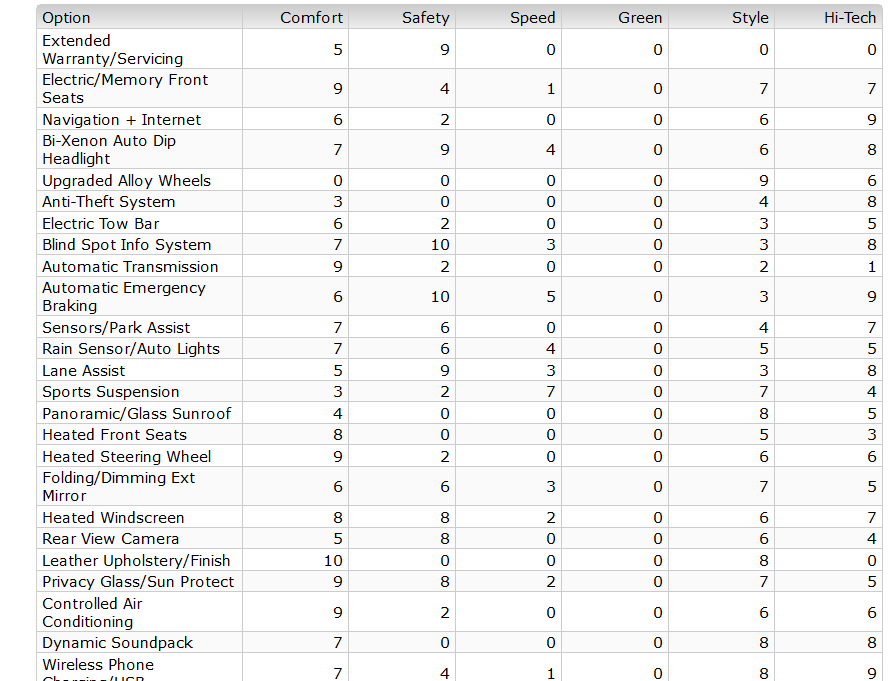
During Round 9, we were torn between price leadership and differentiation – the two generic strategies that can coexist but are difficult to combine. On the one hand, I was aware of the fact that our production capacity was limited. Setting even lower prices would hurt our future profits, and we needed to think long-term. On the other hand, the Marketing team pushed for more customer-centeredness, which ultimately made us consider the key perception factors (see Table 6). We reinvented our production configuration accordingly in the pursuit of the perfect formula.
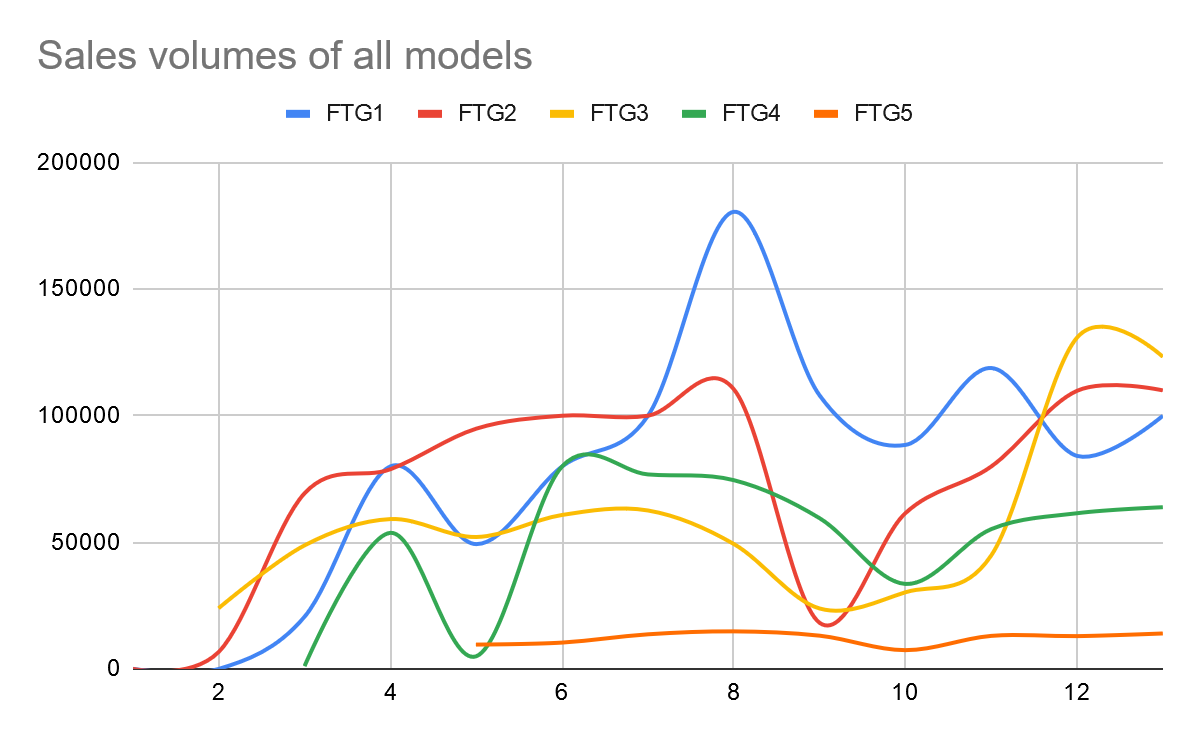
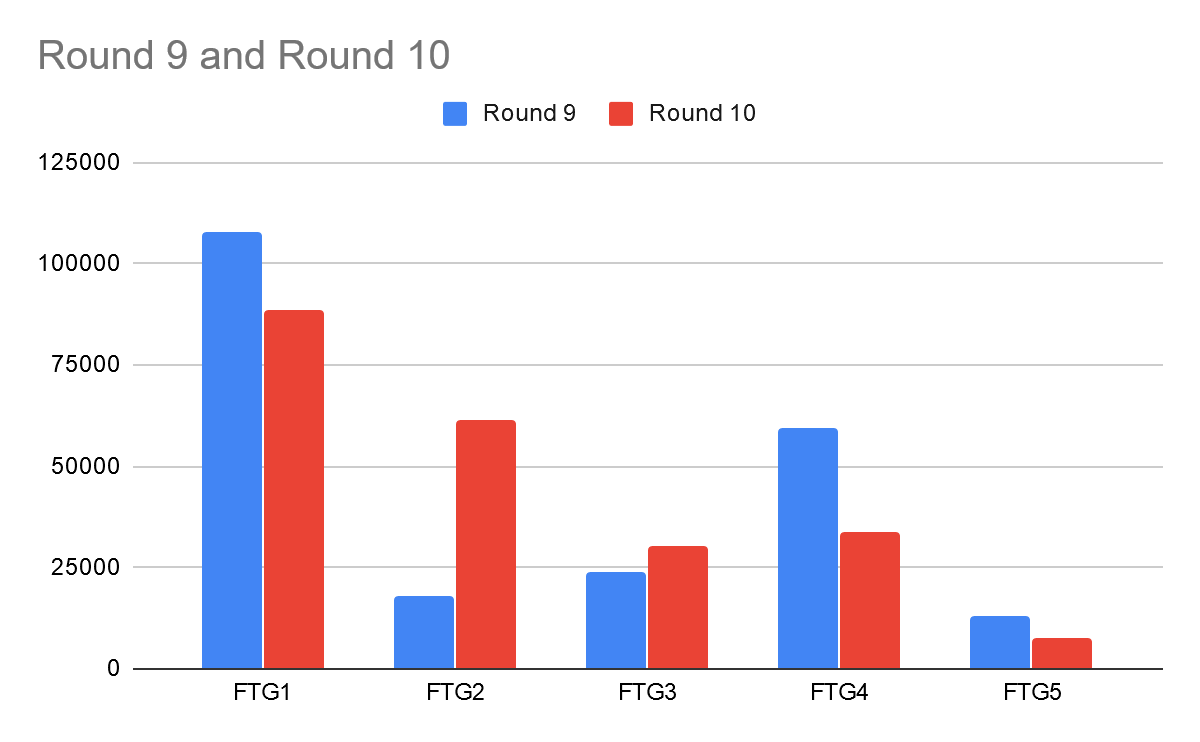
Unfortunately, when we received the results of Round 9, it came to our understanding that the data that we relied on was irrelevant. Graph 1 shows that for FTG1, FTG4, and FTG5, sales volumes decreased by a significant margin. Surely, FTG2 recovered from its underwhelming performance during Round 9. The next few rounds were dedicated to the search for a better configuration that would strike a balance with price and attract customers (Graph 3). Only Round 12 yielded decent results after changing production configuration and lowering prices, and our team decided to continue with this strategy.
Critical Reflection
As much as the experience of interacting with the simulation platform was valuable for everyone involved, I am aware of certain limitations of this business game. What must be made clear is the fact that this is a simulation game, which, by definition, only imitates reality and cannot capture all its nuances (Wolfe, 1997; Greasley, 2017). I understand that there is a large discrepancy between the realism of the data and the actual market. In his critical piece, Laneima (n.d.) opines that since they are but simulated operations, business games allow participants to make bolder adjustments and drastic changes to their production strategy.
Without a doubt, in real life, high-risk high-reward moves also expose manufacturers to the danger of suffering from extreme losses. On top of that, Laneima (n.d.) points out the changing pace of decision-making in the modern business environment. According to the scholar, back in the day, strategic planning saw its heyday when the growth was fast, and the future was more or less easy to predict. Admittedly, from the history of supply chain management (a glimpse into it was provided in the literature review section), we know that it is no longer the case. Disruptive technologies are unpredictable; some companies grow aggressively while others prefer to keep a low profile before taking a leap and gaining a competitive edge (Zhang & Fan, 2010). In this business game, rounds were scheduled, and all teams were making decisions simultaneously – something that does not happen in the business world.
In the literature review, I discussed at length the challenges of data management in organizations. When it comes to the present study, I can say that all the downsides of making use of big data were more or less mitigated. The volume of data that I had to deal with was moderate, and I did not need either additional software or hardware to build up enough computational power. The format was uniform: it was tabular, numeric, standardized, and easy to scrape from the source.
Moreover, I did not have to grapple with variability as the analysis presented in the previous section is exclusively retrospective. I am aware of the fact that as an aspiring data analyst, I am unlikely to work in such comfortable, idealized conditions. However, what, as I think, was close to the realities of supply chain data management is the irrelevance of many categories of data. As seen in the business analysis, our team made some questionable decisions, mainly due to our failures to recognize relevant data. After partaking in the business simulation, I have only grown more convinced of the importance of data management for supply chains.
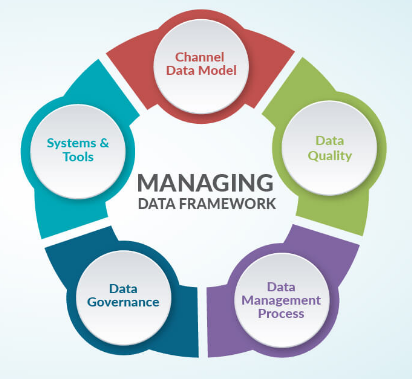
Based on my experience during this business game, my proposed data management framework consists of five elements. These are systems & tools, data quality, data management process, data governance, and channel data model. What could have helped us perform better was a more comprehensive approach to data. Our framework lacked attention to data quality, which is why we allowed irrelevant data to dictate our decisions. Since we were interacting on a pre-made platform, we did not have to take care of data governance. However, we could have refined the data management process more to make sure we make use of relevant data. To conclude, the greatest challenge was measuring the value of information, and every misjudgment was translated into underwhelming results.
Conclusion
Supply chains are dynamic, complex networks whose elements interact with each other and impact each other’s performance. The market for supply chains is prone to disruption when ambitious and aggressive newcomers question the status quo or established leaders reinvent themselves with the help of new technologies. Data management was named one of the top tools for building up resilience and gaining a competitive edge in the current business climate. Big data might be the future of the European automotive industry that, despite its many decades of success, might falter if it fails to develop a long-term vision. This business game tried to simulate the European car market, and our team sought to win the competition by supporting our business decisions with data. It is true that we received mixed results, but the improvements were mainly caused by our ability to locate relevant data and use it to advance our strategy. All in all, data management proved to be a useful tool for enhancing supply chain management, which confirmed my hypothesis.
References
The 5 most disruptive supply chain innovations in 2018. (2019).
Baryannis, G., Dani, S., & Antoniou, G. (2019). Predicting supply chain risks using machine learning: The trade-off between performance and interpretability. Future Generation Computer Systems, 101, 993-1004.
Brochure: Digitising European industry. (2016).
Christensen, M., Raynor, M.E. & McDonald, R. (2015). What is disruptive innovation?. Harvard Business Review.
Christopher, M. (2011). Logistics & supply chain management. Pearson Education Limited.
Cornet, A., Deubener, H., Möller, T., Schaufuss, P., & Tschiesner, A. A long-term vision for the European automotive industry. McKinsey.
DePoy, E., & Gitlin, L. N. (2019). Introduction to research e-book: Understanding and applying multiple strategies. Elsevier Health Sciences.
Easterby-Smith, M., Thorpe, R., Jackson, P. R., & Jaspersen, L. J. (2018). Management and business research. Sage.
eMarketer. (2018). Top 10 US companies*, ranked by retail ecommerce sales share, 2018 (% of US retail ecommerce sales).
European Commission. (2020a). Digitising European industry. Web.
European Commission. (2020b). #digitalsinglemarket digitizing European industry.
Fan, J., Han, F., & Liu, H. (2014). Challenges of big data analysis. National Science Review, 1(2), 293-314.
FinancesOnline. (2020). 51 supply chain statistics you must know: 2020 market share analysis & data.
Ghauri, P., Grønhaug, K., & Strange, R. (2020). Research methods in business studies. Cambridge University Press.
Greasley, A. (2017). Simulation modelling for business. Routledge.
Hazen, B. T., Boone, C. A., Ezell, J. D., & Jones-Farmer, L. A. (2014). Data quality for data science, predictive analytics, and big data in supply chain management: An introduction to the problem and suggestions for research and applications. International Journal of Production Economics, 154, 72-80.
Holtzblatt, K., & Beyer, H. (1997). Contextual design: Defining customer-centered systems. Elsevier.
The International Council on Clean Transportation. (2019). European vehicle market statistics, 2019/2020.
Jato. (2019). Global car market remains stable during 2018, as continuous demand for SUVs offsets decline in sales of Compact cars and MPVs.
Jin, X., Wah, B. W., Cheng, X., & Wang, Y. (2015). Significance and challenges of big data research. Big Data Research, 2(2), 59-64.
Kleinman, K., & Horton, N. J. (2014). SAS and R: Data management, statistical analysis, and graphics. CRC Press.
Kochan, T., Bezrukova, K., Ely, R., Jackson, S., Joshi, A., Jehn, K.,… & Thomas, D. (2003). The effects of diversity on business performance: Report of the diversity research network. Human Resource Management: Published in Cooperation with the School of Business Administration, The University of Michigan and in alliance with the Society of Human Resources Management, 42(1), 3-21.
Koponen, J., & Julkunen, S. (2017). Exploring cultural diversity with business students. Communication Teacher, 31(3), 187-192.
Koptyug, E. (2020). Leading car brand market shares by new registrations 2020.
KPMG. (2017). The digitalisation of the UK automotive industry.
Labrinidis, A., & Jagadish, H. V. (2012). Challenges and opportunities with big data. Proceedings of the VLDB Endowment, 5(12), 2032-2033.
Laneima, T. (n.d.). What’s wrong with business games? Is budget based decision-making up to date? Turku School of Economics and Business Administration.
Laux, J. M. (1992). The European automobile industry. Twayne Pub.
L’heureux, A., Grolinger, K., Elyamany, H. F., & Capretz, M. A. (2017). Machine learning with big data: Challenges and approaches. IEEE Access, 5, 7776-7797.
MarkLines. (2020). France – flash report, sales volume, 2019.
Ross, L. (2020). The state of supply chain management – Statistics and trends [Infographic].
Sanders, N. R. (2015). Big Data Supply Chain (Vol. 27). Beijing: China Renmin University Press.
VanderPlas, J. (2016). Python data science handbook: Essential tools for working with data. O’Reilly Media, Inc.
Vieira, A. A., Dias, L. M., Santos, M. Y., Pereira, G. A., & Oliveira, J. A. (2019). Simulation of an automotive supply chain using big data. Computers & Industrial Engineering, 137, 106033.
Wagner, I. (2020). YTD market share of selected car manufacturers in Europe 2020.
Waller, M. A., & Fawcett, S. E. (2013). Data science, predictive analytics, and big data: a revolution that will transform supply chain design and management. Journal of Business Logistics, 34(2), 77-84.
Wang, G., Gunasekaran, A., Ngai, E. W., & Papadopoulos, T. (2016). Big data analytics in logistics and supply chain management: Certain investigations for research and applications. International Journal of Production Economics, 176, 98-110.
Wolfe, J. (1997). The effectiveness of business games in strategic management course work. Simulation & Gaming, 28(4), 360-376.
Zhang, J., & Fan, Y. (2010). Current state and research trends on business ecosystem. In 2010 IEEE International Conference on Service-Oriented Computing and Applications (SOCA) (pp. 1-5). IEEE.
Zozus, M. (2017). The data book: collection and management of research data. CRC Press.
